Cúram Service Planning provides a Gantt chart which dynamically tracks the progress of a service plan against what was expected. A Gantt chart is a horizontal bar chart, frequently used in project management that helps to plan, coordinate, and track specific activities in a project. The length of these horizontal bars reflects the actual and expected duration of the service plan artifact associated with the bar.
- An expandable tree structure which is used to display the goal and all plan group(s), sub-goal(s), plan item(s), and milestones in a service plan. This enables the case worker to get a complete view of the service plan in a single view or to focus his or her attention on a specific aspect of the plan.
- Hyperlinks which link to the service plan elements' respective detail pages.
- Display options for viewing the time periods for the service plan elements - a case worker can view the expected duration of an element, the actual duration, or a combination of both.
- Summary information for each element of the service plan including the actual and expected start and end dates as well as its duration measured in days.
- For each plan item in the service plan, the name of the participant for whom the plan item is addressing a need or the participant who is responsible for the plan item will be displayed. The participant name that is displayed can be administratively configured.
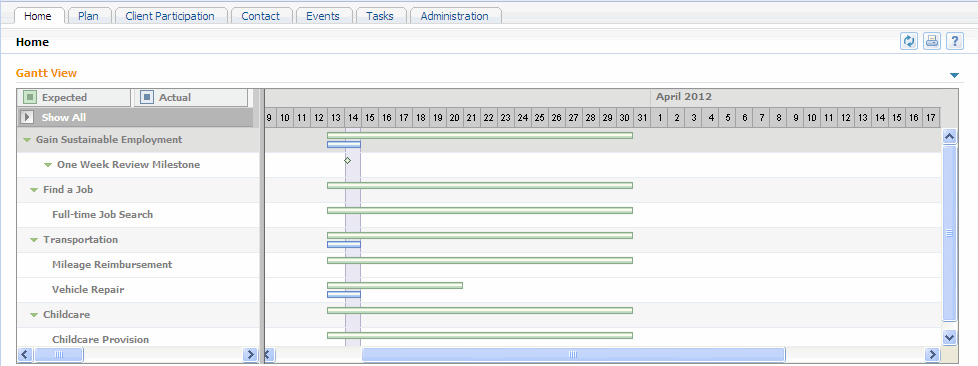
The Tracking Gantt in Figure 4.1 displays a Return to Work service plan. The left-hand side of the chart displays the service plan elements as an expandable tree structure. The service plan goal of Gain Sustainable Employment is at the top level of the tree. Each of the sub-goals are listed below the goal, e.g., Childcare and Find a Job. The plan items for the sub-goals are also displayed, e.g., Childcare Provision is the only plan item in the Childcare sub-goal. A One Week Review Milestone has been added to the service plan and is represented by a diamond. Hyperlinks provide more detail to each page of the service plan element.
There are two ways to view the time periods for service plan elements. The case worker can alternate the views by selecting one of the two options: Actual or Expected. The current view displays both the actual and expected views of the service plan items.
By showing both the actual and expected durations, for example, a case worker can compare actual progression with original estimations. The activity to repair the clients vehicle started and finished earlier than expected. The plan items Child Care Provision, Full-time Job Search and Mileage Reimbursement have yet to start.
The Show All option expands the service plan elements into the tree structure, if they have been collapsed.
Summary information for a service plan element can be displayed in a tool tip by hovering the mouse over that element's bar on the right-hand pane.