Current Deep Thunder Forecast for Greater Austin and San Antonio Metropolitan Areas

Surface Air Temperature and Winds at 2 km between Data Points

Description
 This page contains an animation that is a visualization of the Deep
Thunder forecast focused on the greater Austin and San Antonio metropolitan areas
It uses data from the high-resolution nest at 2 km resolution. Each time
step corresponds to 30 minutes of forecast time. The specific
data and representation shown are for potential use for short-term weather-sensitive operations and
planning.
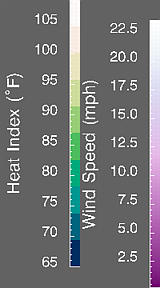
They show the local terrain as a shaded surface that is colored by contour
bands of surface air temperature (degrees Fahrenheit), following the closest scale to the upper
right.
This page contains an animation that is a visualization of the Deep
Thunder forecast focused on the greater Austin and San Antonio metropolitan areas
It uses data from the high-resolution nest at 2 km resolution. Each time
step corresponds to 30 minutes of forecast time. The specific
data and representation shown are for potential use for short-term weather-sensitive operations and
planning.
They show the local terrain as a shaded surface that is colored by contour
bands of surface air temperature (degrees Fahrenheit), following the closest scale to the upper
right.
During windy winter days, contour bands of wind chill temperature
will be shown instead. Wind chill is an apparent temperature due
to effect of wind on the skin. In addition, on colder days, a thick light blue
line will mark the location of the freezing point of water.
During humid summer days,
contour bands of heat index temperature will
be shown instead. Heat index is an apparent temperature due to the
effect of humidity.
The terrain is overlaid with maps of
rivers in blue, county boundaries in dark gray and highways in light gray. Individual landmarks
and cities are shown by name with the predicted surface air temperature for that time
step. The map is also overlaid with arrows corresponding to predicted
winds. The arrows point in the direction of the wind and are colored
by speed following the further scale to the right. The faster winds are
colored in lighter shades toward white, while the lighter winds are darker in color.
Instructions
The animation on this page is composed of a set of individual JPEG images
with 30 minutes of forecast time between each frame. Depending
on your connection speed and that of your computer, the animation may take
a few minutes to load and decompress in your browser. When
it is completed, the animation will play. There are VCR-like
controls under the animation to enable you to stop playback, play forward
or backward, or step through the frames one at a time, control the speed
of playback, etc.
The mode of playback is controlled via the bottom set of buttons. Click on
the button once, corresponding to the mode of choice (Once: play once in the
cuirrent direction; Repeat: play repeatedly in the current direction;
Swing: play forward and backward). The top buttons are used to single step or
animate or pause in a forward or backward direction. The speed of
playback can be controlled with the buttons marked Slower and Faster.
If you are having problems viewing or interacting
with this animation, make sure your browser has Javascript enabled.
If the forecast information presented on this page does not seem to
be current and you have visited this site recently, the results of the
previous visit may have been saved in your web browser's cache. If so,
you should change your cache settings (e.g., File->Preferences->Advanced->Cache
in Netscape and set the document comparison to "Every time"). When you
restart your browser, the problem should be solved. For your current session,
you should manually clear the cache and reload the page.
Learn
More about Deep Thunder
Learn
More about how Deep Thunder Visualizes the Data Generated by the
Weather Model
Current Weather Information and
Predictions for Austin/San Antonio, TX (from the National Weather Service)
Current Model Results from the
National Weather Service