Agilent Emulation Probe Interface Guide This utility is available only with Rational Apex Embedded for Rational Exec.
Rational Apex Embedded provides a convenient integration with the popular Emulation Probe product line from Agilent Technologies (formally a division of HP).
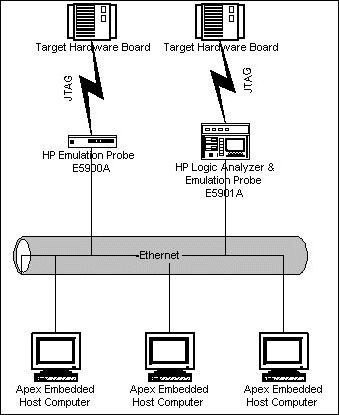
The Emulation Probe (sometimes referred to as the SoftProbe) is used as a communication conduit between Rational Apex Embedded and the user's target hardware as shown in Figure 1. Rational Apex Embedded communicates with the Emulation Probe over an ethernet connection. The Emulation Probe communicates with the target board through a dedicated JTAG port.
The Rational Apex Embedded environment is fully integrated with the Emulation Probe, which allows for applications to be downloaded and debugged through the Emulation Probe from the Rational Apex Embedded environment.
There are several advantages in using Rational Apex Embedded with an Emulation Probe:
- Makes the need for Apex's TDM (Target Debug Monitor) unnecessary. TDM does require target board resources and can often be difficult to debug, especially when used on custom hardware
- Downloading application code is extremely fast, especially compared to doing it over a serial communication line
- Target hardware may not have onboard ethernet or other means for communicating with the Apex Embedded host computer
- Makes debugging low-level software more convenient because you can utilize the hardware-oriented features of the probe
This chapter contains useful information for configuring Rational Apex Embedded for Rational Exec for use with the Emulation Probe:
You will need to refer to your probe's documentation for specific probe-related information.
Figure 1 Emulation Probe Communication
OverviewThere are few issues to consider when using Rational Apex Embedded with an Emulation Probe. This section identifies them:
Choose the correct Emulation Probe
Agilent Technologies makes many different types of emulators, logic analyzers, and emulation probes. Not all of them are compatible with Rational Apex Embedded. The following table will help you identify the correct model of Emulation Probe model:
Note: Agilent Technologies sells two types of emulation probe technology. The Emulator Probe is a stand-alone product. The Emulation Module is intended to be used with an Agilent 16600A Logic Analyzer.
Contact Agilent Technologies at http://www.tmo.hp.com for additional information on the Emulation Probe.
Currently, Rational Apex Embedded is not integrated with any other emulation or probe technology.
Boards with JTAG Ports
Not all commercial-off-the-shelf boards have built-in JTAG ports. This will limit the types of boards with which you can use the Emulation Probe. You should check with your board manufacturer to see if a JTAG port is standard or optional on boards you are considering.
At Rational Software we have used JTAG connectors on Motorola MVME1600 family, MVME2000 family, DY4 DMV176, Pentium, and PowerPC 860 boards. The JTAG is not standard on the MVME2000 family boards, but there is an available add-on card that connects to the board and provides the JTAG connector.
Emulation Probe and Alternative Connections
As described elsewhere in this document, Rational Apex Embedded provides several different options for host/target communication. This section summarizes the pros and cons of each:
Serial Connection via TDM (Target Debug Monitor)
- Inexpensive to implement on the target & takes up little board real estate
- Support for this is included with Rational Apex Embedded
- Relatively simple to configure TDM
- Does not require special hardware equipment
- Target text_io is efficiently handled by TDM
- Very slow communication speed. Not practical to download large applications
- An application crash could crash TDM
- Configuring TDM is required for target board
Ethernet Connection via ETDM (Ethernet Target Debug Monitor)
- Very fast communication between host/target
- Short download times
- Does not require special hardware equipment
- Target Text_io is efficiently handled by ETDM
- Configuring of ETDM is required – more complex & time consuming than serial TDM
- Separately purchased add-on to Apex Embedded
- Requires more hardware real-estate on target board & is more expensive than a serial port
- An application crash could crash ETDM
Emulation Probe
- Apex Embedded host/target communication interface does not require TDM or ETDM
- Does not require a dedicated communication port (other than a JTAG debug port)
- Short download times
- Can be useful in debugging TDM or ETDM
- Does require special hardware equipment (Emulation Probe)
- Target Text_io is not efficient and can slow down the target application
- Single stepping source code is not as efficient as with TDM or ETDM
Setting Up the Emulation ProbeThis section describes how to verify that the Emulation Probe connection is working and how to configure the Emulation Probe interface.
- Install the Agilent Emulation Probe and connect it to the local ethernet according to the guidelines provided in the Agilent E5900A Series Installation/Service/Support Manual.
- Update the /etc/services file as described in Establish the Software Probe Service.
Note: Setting up the Emulation Probe requires modification of two system files: /etc/services and /etc/hosts. On UNIX the /etc directory is found in the root directory (/); on NT the /etc directory is found in the WINNT\System32\Drivers directory. If your network uses "Yellow Pages" consult your system administrator to make the necessary changes.
Verify the Host to Agilent Emulation Probe Connection
Test the network connection from the host to the Emulation Probe. The easiest way to verify the connection is to use telnet.
Note: It is recommended, but not required, to enter a name in /etc/hosts on the host for the Internet address of the Emulation Probe. It is easier to telnet to a name rather than an Internet address.
Named Address
The /etc/hosts entry below maps the name probe to the Agilent Emulation Probe at Internet address 192.41.137.22.
Verify that you can talk to the Agilent Emulation Probe using telnet and the name assigned to the Agilent Emulation Probe:
Internet Address
You should see a telnet connect message and a prompt from the Agilent Emulation Probe:
or a connect message and a prompt from the Agilent Emulation Probe:
See the target-specific Software Probe Terminal Interface User's Guide for a discussion of the Agilent Emulation Probe prompts.
At this point, terminate the session with Control-d.
If you did not telnet successfully, go back to the Agilent Installation/Service/Support Manual to determine what went wrong with the Ethernet installation. For the Apex Interface to work, you must be able to telnet successfully to the Agilent Emulation Software Probe.
Establish the Software Probe Service
The Agilent Emulation Probe Interface references the emu1700 service for a communication port number. To add this service, add the following line to your hosts /etc/services file.
If you are running NIS, contact your system administrator for help in adding this service (see the Agilent E5900A Series Installation/Services Guide).
Select Tools > Targets
From the Target Control Dialog, select the Agilent Emulation Target Type. The hostname you specify is the Internet hostname address of your probe.
Trouble Shooting
Telnet Tricks
Once the host to Agilent Emulation Probe ethernet connection is established, you can use telnet at any time to determine the state of the Probe. The prompt that follows the connect message indicates the current state of the Probe.
If there is no connect message from telnet, there may be a problem with the ethernet connection. Reset the Probe using the on/off button on the box.
In addition, you can issue Agilent Emulation Probe commands directly to the Probe at any point after the telnet connect and a Software Probe prompt. This is useful to check the PC and SP registers if the Software Probe seems to be hanging.
See the Agilent Emulation Probes Terminal Interface Reference for a list of Agilent Emulation Probe commands.
Ethernet Issues
If the Agilent Emulation Probe hangs when using apex_execute to run a number of executables in succession, there may be a problem with the Agilent Emulation Probe LAN card. Notify Agilent.
Note: This behavior was observed at Rational Software Corporation while running the ACVC test suite on the Agilent Emulation Probe. The behavior was that apex_execute started to download a test and then nothing happened. There was no output from the user program and the Software Probe would not respond to telnet. A temporary work-around is to reset the Software Probe by turning the box off and on and then run only a few executables in succession or just run low ethernet traffic executables, that is minimal I/O.
Emulator Configuration
The interface product reads Software Probe initialization commands from two files. The Software Probe configuration file specified with the APEX_EMU_CONFIG environment variable and the download configuration file specified with APEX_DL_CONFIG. The Software Probe configuration file contains Software Probe commands that are executed at startup, for example, when the debugger is invoked. The download configuration file contains commands that are executed whenever a program is downloaded, for example, when the debugger load command is invoked.
If you need to execute any of the emulator commands before you start debugging, you must set the environment variables APEX_EMU_CONFIG and APEX_DL_CONFIG with the pathnames of your Software Probe initialization files.
Known Interface LimitationsMemory Near the Edges
The debugger always reads memory in 64 byte chunks; however, it does not always read at a 64 byte boundary. As a result, it is possible for a chunk to span a major memory boundary. If part of the memory is there but the part `over the boundary' is not, then the Hewlett-Packard software (and the debugger) reports errors and no memory is read. There is no quick fix for this problem, so it is best to give yourself 64 bytes of padding when initializing your SP register to point to the high end of RAM.
You may also use the debugger's set memory command to protect debugger requests to read inaccessible memory.
Single stepping
The Rational Software Corporation debugger uses the following algorithm for single stepping at the source level:
    src_line := line_of(cur_instruction);
    src_file := file_of(cur_instruction);
    loop
        step_one_instruction;
        if src_line /= line_of(cur_instruction) or
            src_file /=file_of(cur_instruction)
        then
            exit;  -- we've stepped to a new source line
        end if;
    end loop;
This algorithm works well if the time to single step one instruction is very fast. However, in this cross-debugging environment, with multiple processes, ethernet communication, etc., the overhead is high and therefore single stepping at the source statement level is slow.
To avoid delays, set a breakpoint several statements ahead and use the g command, instead of stepping each source line.
Stepping into a task is a special case which amplifies the slowness of this algorithm. An entire section of the RTS is stepped through one instruction at a time. We recommend that you set a breakpoint in the task of interest and use the g command.
| Rational Software Corporation http://www.rational.com support@rational.com techpubs@rational.com Copyright © 1993-2002, Rational Software Corporation. All rights reserved. |