|
|

© 2003 Rational Software Corporation. All Rights Reserved.
Any reproduction or distribution of this work is expressly prohibited without the prior written consent of Rational.
|
|
|
|
Contents
Welcome to Rational PureCoverage for Java
Experienced PureCoverage users
PureCoverage for Java: What it does
Monitoring Code Coverage for a Java Program
Running a program under PureCoverage
Walkthrough: Running the Sort example program
Using the PureCoverage viewer window
Using the Annotated Source window
Merging data from multiple runs
|
|
|
|
PureCoverage can collect coverage data for Java applications running on a Solaris SPARC 32-bit Java virtual machine (JVM).
This document is a supplement to the PureCoverage online help system for Java programmers. It is intended both for new PureCoverage users and for experienced PureCoverage users.
This document provides basic instructions for collecting code coverage data for your Java application, as well as an overview of PureCoverage's features.
You can use the information provided here to get up and running with PureCoverage. Then refer to the PureCoverage online help system for detailed information, keeping in mind the differences between using PureCoverage for Java and for C/C++ as specified in this supplement.
Using PureCoverage for Java is essentially the same as using PureCoverage on C/C++ programs. Much of the information in this supplement will already be familiar.
 New information - information that applies only to PureCoverage for Java - is marked with
coffee beans.
 PureCoverage for Java: What it does
Measuring code coverage is a critical part of software testing. You can't guarantee the quality of your code unless you've tested it thoroughly, and you can't be sure that you've tested thoroughly unless you have a way to measure code coverage.
Rational PureCoverage provides accurate code coverage information that identifies all the gaps in your testing, and indicates where you need to develop additional tests. You can use PureCoverage on:
Whenever a Java method is exercised, the Java Virtual Machine Profiling Interface (JVMPI) reports it. In addition, PureCoverage reports whenever a line or basic block is exercised: it does this by inserting monitoring instructions dynamically in memory using Byte Code Insertion (BCI) technology. PureCoverage saves this data in a .pcv file that shows which methods, lines, and basic blocks have been hit and which have not.
Note: PureCoverage can collect and display coverage data at different levels of detail. By default, PureCoverage displays data at line level for classes that include line information, and at method level for classes that do not include line information. For native methods, unlike Java methods, PureCoverage always collects coverage data only at the method level.
The PureCoverage .purecov.java file, options and application programming interface (API) methods allow you to control how data is collected. You can, for example, collect data for a small portion of your application's execution or for the entire run.
|
|
|
 To collect Java code coverage data, run PureCoverage with the -java
option, as follows:
For an applet:
% purecov [<PureCoverage options>] -java <applet viewer> [<applet viewer
options>]
<html file>
For a class file:
% purecov [<PureCoverage options>] -java <Java executable> [<Java
options>] <class>
For a JAR file:
% purecov [<PureCoverage options>] -java <Java executable> [<Java
options>]
<JAR switch> <JAR file>.jar
For a container program:
% purecov [<PureCoverage options>] -java <exename> [<arguments
to exename>]
Create a working directory for running the Sort example. Then go to the the example_java directory in your PureCoverage home directory:
cd `purecov -printhomedir`/example_java
and copy the source file, Sort.java, to your working directory for the example.
Make sure both PureCoverage and your Java compiler are on your path. Then compile the example:
javac Sort.java
and run it under PureCoverage:
purecov -java java Sort
PureCoverage prints license and support information, and then executes the Sort program:

To display coverage data, exit the instrumented program and type:
% purecov -view java.pcv &
This command opens the PureCoverage viewer.
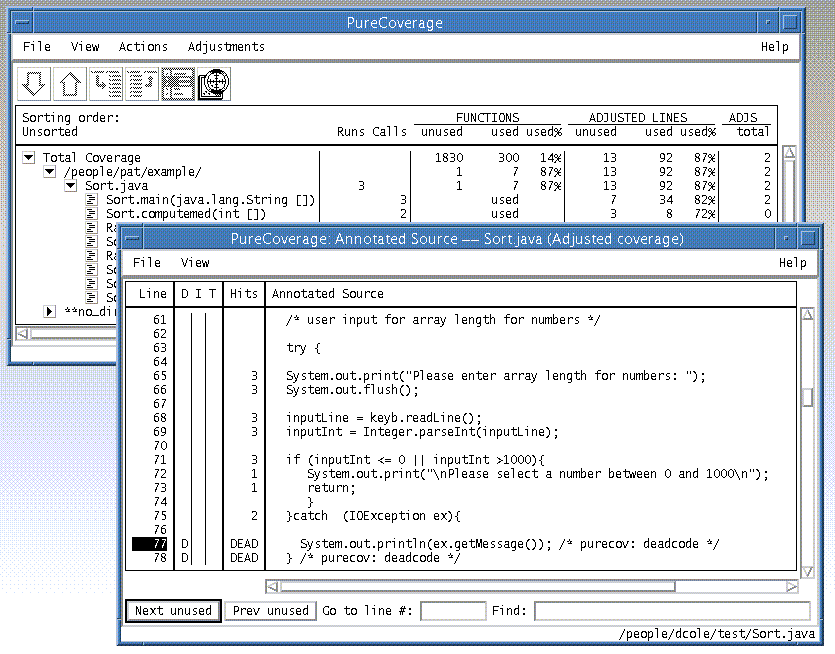
The PureCoverage viewer displays statistics for the run.
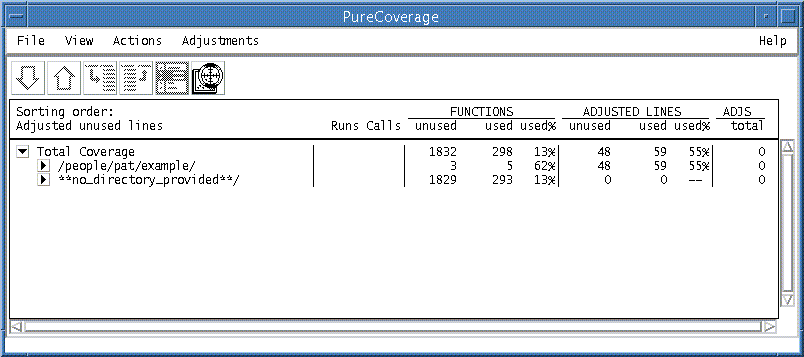
The statistics for Sort are listed following the working directory, /people/pat/example. In the FUNCTIONS columns for the directory, PureCoverage reports that three methods remain unused, or untested, while five methods were used in the course of this run. In the ADJUSTED LINES columns, PureCoverage reports that 48 remain unused while 55 were used.
Note: The default header for line statistics is ADJUSTED LINES, not just LINES. This is because PureCoverage has an adjustments feature that lets you account for phenomena such as dead code in your statistics.
Click the  button next to the /people/pat/example/
directory entry to show file-level information, which lists the Java files in the directory and
file-level coverage data. Since there is only one Java file in the /people/pat/example/ directory,
the coverage data for the file and the directory are the same.
Then click the  button next to the Sort.java file entry to show
method-level information.
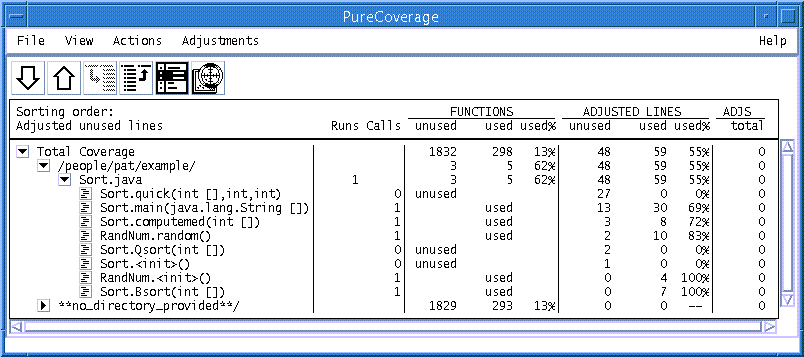
The list expands to show each method in Sort.java. PureCoverage tells you whether the method was used or unused. Since we chose to perform a bubble sort, the method for performing a quick sort, Sort.quick, is unused. PureCoverage also indicates the number of unused and used lines in each method. Check the relatively large number of unused ADJUSTED LINES that the Sort.quick method is responsible for: With 27 unused lines, it is at the top of the list of methods. (The methods are sorted, by default, on the basis of Adjusted unused lines.)
Given these statistics, the most obvious way to improve testing coverage of the Sort program is to exercise the Sort.quick method. To do this, run the program again. (Don't close PureCoverage so that you can see what happens.) This time, choose to perform a quick sort. When the program exits, PureCoverage displays the following screen:

What does this mean? It means that PureCoverage has merged the statistics for this run of Sort with the statistics of the previous run. You can now reload the newly modified .pcv coverage data file. Select Reload changed .pcv files to see the results.
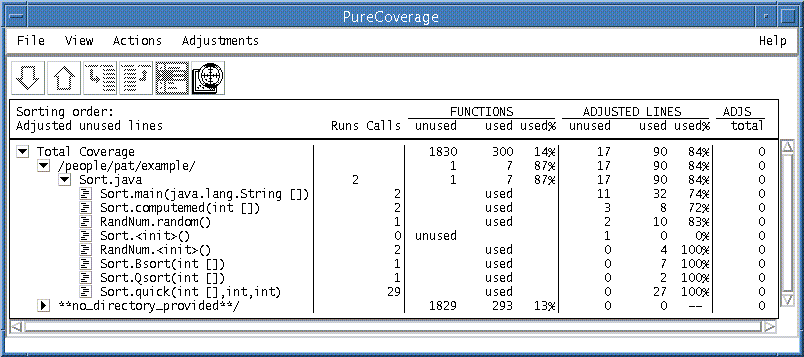
The coverage totals have improved significantly: Line-level coverage of the Sort.java source file is up from 55% to 84%.
In addition to showing untested methods, PureCoverage also shows untested lines. (Note that the class files must include line numbers for PureCoverage to be able to do this.
The PureCoverage viewer shows that the largest concentration of lines remaining unused are in the Sort.main method.
To see the unused lines,
click  next to the method name.
This opens the Annotated Source window, which displays
a copy of the source
code marked up with coverage data for each executable line of code.
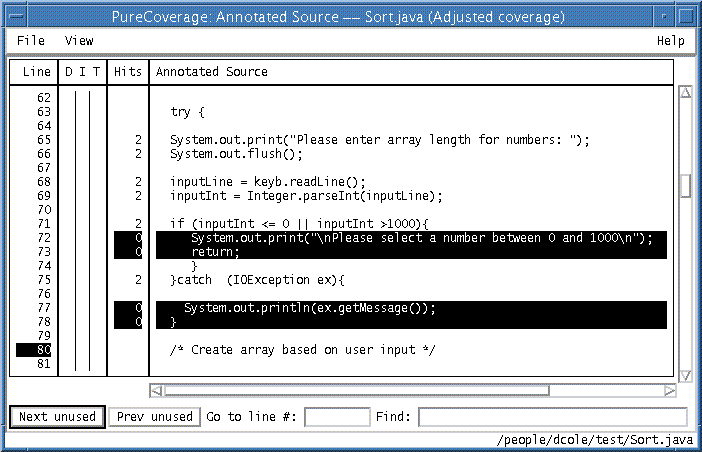
The first group of unused lines in the Sort.main method, lines 72 and 73 will be used only if you enter an unacceptable value for the array length. To use these lines, rerun the program and enter "0" when prompted.
This will give us improved line coverage statistics for Sort.main: 9 unused lines and 34 used lines.
They are used only under very unusual circumstances, but are still required
for proper exception handling. Given your testing situation, these
are unreachable lines of code.
In order to present a more useful set of coverage statistics,
and to reflect more accurately what remains to be tested,
PureCoverage lets you "adjust" them.
In the Annotates Source window,
click on the column headed D opposite each line.
The result is that the lines are marked DEAD, and
the statistics in the viewer are adjusted accordingly:
Note that the adjustment does not change the number of lines used. It just reduces
the total number of lines reported for the method. As a result, you now have
7 unused lines (two fewer than before the adjustment) and 34 used lines.
You can
also mark lines or sections of code as tested code
(code you've tested in another context) or
inspected code (code you've examined and know to be error-free).
You can mark adjustments directly in your code,
as well as in the Annotated Source window. For more information,
look up "adjustments" in the
PureCoverage online help index.
You now have seen the basic steps for using PureCoverage to collect coverage data.
Try to complete testing for the Sort example.
Meanwhile, PureCoverage
has other features to make the data easier to read and interpret.
To sort the coverage data, select
View > Select sorting order, then select the order you want.
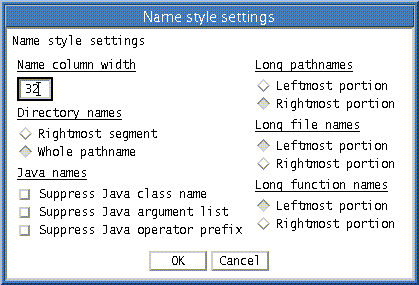
To control how method names
are displayed in the current PureCoverage window, select
View > Set display style for names . . ..
Enter the display changes you want to make in the dialog box:
By default, PureCoverage merges the results of multiple runs of the
same program to provide cumulative information about program
coverage.
You can, however, keep the results of each run separate. To do this,
use the -counts-file option in the command line.
If you write data to separate coverage files, you can subsequently:
PureCoverage automatically saves the data it collects in a .pcv file
when you exit your program.
If you want to display your coverage data on a Windows machine, you can use the
PureCoverage
-view-file-format option to save the data in the Windows format in addition
to, or instead of, the UNIX format.
You can save data displayed in the viewer after you make adjustments, or
after you merge data files manually.
To save the data to a binary .pcv
file (one that you can view in the
PureCoverage user interface), or to save the data in export format
(a text file suitable for processing by scripts), use the Write commands in the
File menu.
You can analyze a
saved dataset with the command purecov -view filename.pcv,
just as you do after collecting coverage data.
This displays the file in the PureCoverage viewer.
You can use PureCoverage report scripts to format and process PureCoverage data. The
report scripts are located in the <purecovhome>/scripts directory.
Select File > Run script to open the script dialog.
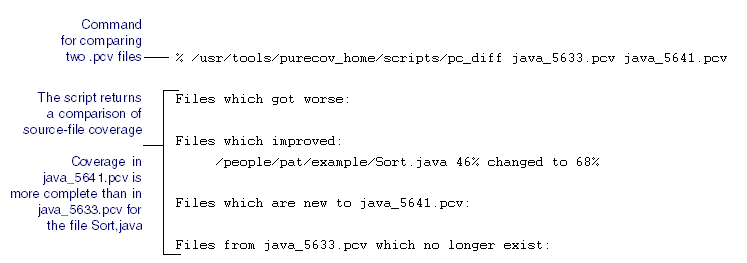
You can also run scripts from the command line. For example, to
run the script that generates a "diff" report for two .pcv files, use
the following command:
% pc_diff [-apply-adjustments=no] old.pcv new.pcv
Output is in text format, as follows:
PureCoverage report scripts allow you generate
many useful reports. For example, you can get a report of files with low
coverage, summarize coverage data in spreadsheet format,
list files for which coverage has changed, annotate a copy of the source file
with coverage data, and mail a low coverage report to
the last user to modify
insufficiently covered files. You can also write
your own custom scripts to process coverage data.
For a complete list of the PureCoverage report scripts, look up
"script" in the PureCoverage online help system.
PureCoverage provides a .purecov.java file,
run-time options, and
API methods that help you control PureCoverage's behavior.
PureCoverage includes a file
named .purecov.java,
located in the <purecovhome> directory, that helps
you control the way PureCoverage profiles Java code.
You can define directives
in .purecov.java to set prefilters.
These prefilters prevent PureCoverage from collecting
data you don't want to consider and, as a consequence, improve the performance of your
code as it runs under PureCoverage.
The file also includes directives for setting
options and identifying shared objects.
For specific information and examples of directive formats, refer to the documentation
provided in the .purecov.java file.
PureCoverage looks for this file in your current working directory and in
your home directory, as well as
in <purecovhome>. You can copy the file to your
working directory or home directory, and modify it with directives specific to
your current project.
The file in your current working directory takes precedence over the file in
your home directory. These two files take precedence over the file in
the <purecovhome> directory.
Note that the options precedence for Java programs
differs from the options precedence for C and C++ programs, which is documented
in the PureCoverage online help system.
By default, PureCoverage
tracks coverage for each method and displays this in the PureCoverage viewer.
PureCoverage also reports coverage information
for individual lines when debugging information is available.
To specify the level
of granularity for code that contains debugging information, use
the
-purecov-granularity
option. PureCoverage
recognizes the values
method
and
line
for Java profiling.
For example, to
collect data at method granularity for an applet, type (on
csh):
% setenv
PURECOVOPTIONS -purecov-granularity=method
For Java code, the options classified as "build-time options"
are actually applied at run time. The build-time classification applies to C and C++
code, and reflects the how the options are organized in the PureCoverage online help system.
Refer to the PureCoverage online help system for full descriptions of all the options.
Build-time options:
Runtime options
Analysis-time options
Analysis-time mode options
PureAPI methods
let you control the collection of coverage during program
execution. You can call these methods from a debugger or
call them directly from your Java program code.
To call an API method, use the following syntax:
Rational.PureAPI.IsRunning()
PureAPI is a Java class that includes all the API methods
that can be used with PureCoverage when profiling Java code.
The PureAPI class is part of a Java package
called Rational.jar, which is located in
<purecovhome>.
You can run class files that include calls to PureAPI methods
with or without PureCoverage. When you run a class file with PureCoverage,
PureCoverage automatically sets
CLASSPATH and
LD_LIBRARY_PATH to
access
Rational.jar and
libQProgJ.so. When you run the class file without
PureCoverage, you must add
<purecovhome>/lib32 to your
LD_LIBRARY_PATH. If you do not have a
Rational.jar file in
your
<javahome>/jre/lib/ext directory, you must add
<purecovhome> to your
CLASSPATH.
The PureAPI methods are as follows. Note that some are not supported
in PureCoverage.
Returns
true
when PureCoverage is running.
Sets a flag which prevents PureCoverage from writing
the accumulated data when the program exits or executes another
program.
CAUTION: Once you call this method, you cannot reverse it. No data will be
written for the current process or for any children created
after this API method is called.
This method always returns
true.
Tells PureCoverage to clear all the data it has recorded about
your program's code coverage to this point. You can use this method,
for example, to ignore the code coverage of the startup phase of your program.
This method always returns
true.
Saves all the data recorded since program start
(or the last call to
clearData()) into a dataset (a
.pcv
file).
Note:This method calls
clearData()
after saving the data.
This method returns
true
if successful, and
false
otherwise.
Using viewer display features
Selecting the sorting order

Shortening
method names in the viewer
 PureCoverage for Java can
suppress package, subpackage, class, and argument list information
from method names. PureCoverage for Java does not suppress package and
class name information from argument types in the argument
list.
Merging data from multiple runs
Saving code coverage data
 By default, PureCoverage
bases the name of the .pcv file on the program name you specify on
the command line. In the case of Java, this program name is not the name of
your program, but rather the name
of the applet viewer, Java executable, or container program that you
specified. You can use the PureCoverage
-counts-file
option to assign the .pcv
file a name that identifies your own Java code.
Generating coverage reports with PureCoverage scripts
Controlling data collection
Using the .purecov.java file
Using PureCoverage
options
 You can specify PureCoverage options for Java programs in the following ways,
listed in order of highest to lowest precedence:
Controlling the
granularity of collected data
% purecov -java <applet viewer> <html file>
PureCoverage options for Java
 The following tables show which PureCoverage options you can
use for profiling Java code. (PureCoverage ignores options that are relevant only to C and C++ code
when profiling Java code.) For further information about options, see the PureCoverage online help system.
-always-use-cache-dir
not relevant
-auto-mount-prefix
yes
-cache-dir
not relevant
-collector
not relevant
-debug
yes
-follow-terminal-symlinks
not relevant
-forbidden-directories
not relevant
-force-rebuild
not relevant
-help
yes
-ignore-objdebug-shlib
not relevant
-ignore-run-time-environment
yes
-lib-path-length
not relevant
-linker
not relevant
-no-link
not relevant
-purecov-granularity
yes (Values for Java are method and line.)
-print-home-dir
yes
-save-tmp-files
not relevant
-test-license
yes
-usage
yes
-use-subdir
not relevant
-verbose
yes
-version
yes
-append-log-file
yes
-auto-mount-prefix
yes
-copy-fd-output-to-logfile
not relevant
-counts-file
yes
-follow-child-processes
yes
-force-merge
yes
-handle-signals
not relevant
-ignore-signals
not relevant
-log-file
yes
-max-threads
yes
-program-name
not relevant
-pure-help-max-wait
yes
-replace-path
not relevant
-run-at-exit
yes
-thread-debug-assertions
yes
-thread-trace-contexts
yes
-thread-trace-locks
yes
-user-path
yes
-view-file-format
yes
-apply-adjustments
yes
-force-merge
yes
-user-path
yes
-export
yes
-extract
yes
-merge
yes
-view
yes
 Calling PureAPI
methods
or
import Rational.PureAPI;
. . .
PureAPI.IsRunning()
These API methods can also be used with Rational Quantify, Rational Software's performance profiling tool.
public static int IsRunning();
public static int DisableRecordingData();
public static int StartRecordingData();
Not supported in PureCoverage.
public static int StopRecordingData();
Not supported in PureCoverage.
public static int IsRecordingData();
Not supported in PureCoverage.
public static int ClearData();
public static int SaveData();
public static int AddAnnotation(String annotation);
Not supported in PureCoverage.