|
|

© 2002-2003 Rational Software Corporation. All Rights Reserved.
Any reproduction or distribution of this work is expressly prohibited without the prior written consent of Rational.
|
|
|
|
Contents
Welcome to Rational Quantify for Java
Quantify for Java: What it does
Quantify'ing a Java Program
Running a program under Quantify
Interpreting the program summary
Quantify's data analysis windows
Using the Function List window
Finding and filtering functions
Expanding and collapsing descendants
Using the Function Detail window
Changing the scale and precision of data
Using the Annotated Source window
|
|
|
|
Quantify can collect coverage data for Java applications running on a Solaris SPARC 32-bit Java virtual machine (JVM).
This document is a supplement to the Quantify online help system for Java programmers. It is intended both for new Quantify users and for experienced Quantify users.
This document provides basic instructions for collecting performance data for your Java application, as well as an overview of Quantify's features.
You can use the information provided here to get up and running with Quantify. Then refer to the Quantify online help system for detailed information, keeping in mind the differences between using Quantify for Java and for C/C++ as specified in this supplement.
Using Quantify for Java is essentially the same as using Quantify on C/C++ programs. Much of the information in this supplement will already be familiar.
 New information--information that applies only to Quantify for Java--is marked with
coffee beans.
 Quantify for Java: What it does
The time your Java program takes to run depends on a number of factors: which bytecodes the Java Virtual Machine executes, how many machine cycles each bytecode requires, and the machine's clock rate.
Rational Quantify provides accurate performance information for Java applets, class files, .jar files, and code launched by container programs in conjunction with a Java virtual machine (JVM). This information helps you identify the portions of your Java applet or application that dominate its execution time, where you can make the greatest improvements in performance.
For Java code, Quantify uses the Java Virtual Machine Profiling Interface (JVMPI) and Byte Code Insertion (BCI) technology to get method entry, method exit and line entry notifications, and measures the time elapsed between these events. BCI is performed only when line level coverage is needed, and is done dynamically at class load time.
When you exit your program, Quantify organizes the performance data that it has collected and shows you where your code is encountering bottlenecks. For classes that include debug information, Quantify also measures the time spent in each basic block. Quantify collects accurate data for how a Java program actually performs on your machine, but because Quantify collects Java data by timing, and not by counting cycles per machine instruction as it does for C/C++ programs, the Java results are not repeatable.
Quantify accurately distributes each method's time to its callers so you can tell at a glance which function calls were responsible for the majority of your program's time. Quantify's graphical data display windows allow you to locate bottlenecks and to verify performance improvements over your entire application.
The Quantify .quantify.java file, options and application programming interface (API) methods that allow you to control how data is collected. You can collect data for a small portion of your application's execution or for the entire run. As soon as you can run a test program, you can collect meaningful performance data and establish a baseline for future comparison.
Note:
Quantify records
elapsed time for your native methods but does not display
call details for the C/C++ functions that implement those native methods.
You must use Quantify for Java against a simple C/C++ test application and
your shared libraries to determine bottlenecks in your native method code.
|
|
|
 To collect Java performance data, run Quantify with the -java
option, as follows:
For an applet:
% quantify [<Quantify options>] -java <applet viewer> [<applet viewer
options>]
<html file>
For a class file:
% quantify [<Quantify options>] -java <Java executable> [<Java
options>] <class>
For a JAR file:
% quantify [<Quantify options>] -java <Java executable> [<Java
options>]
<JAR switch> <JAR file>.jar
For a container program:
% quantify [<Quantify options>] -java <exename> [<arguments
to exename>]
Note: Quantify can collect line-by-line performance data or method-level data. By default, Quantify uses the line level when debug data, which is stored in class files, is available.
When Quantify starts, it prints license and support information, followed by the expected output from your program.
When your program finishes execution, Quantify transmits the performance data it collected to its data analysis program, qv.
 Quantify prints a
program summary after each dataset is
transmitted. It shows at a glance, how the original, uninstrumented
program is expected to perform. Note that the figures for Java also include
some Quantify overhead.

After transmitting the last dataset, Quantify displays the Control Panel. From here, you can display Quantify's data analysis windows and begin the performance analysis.
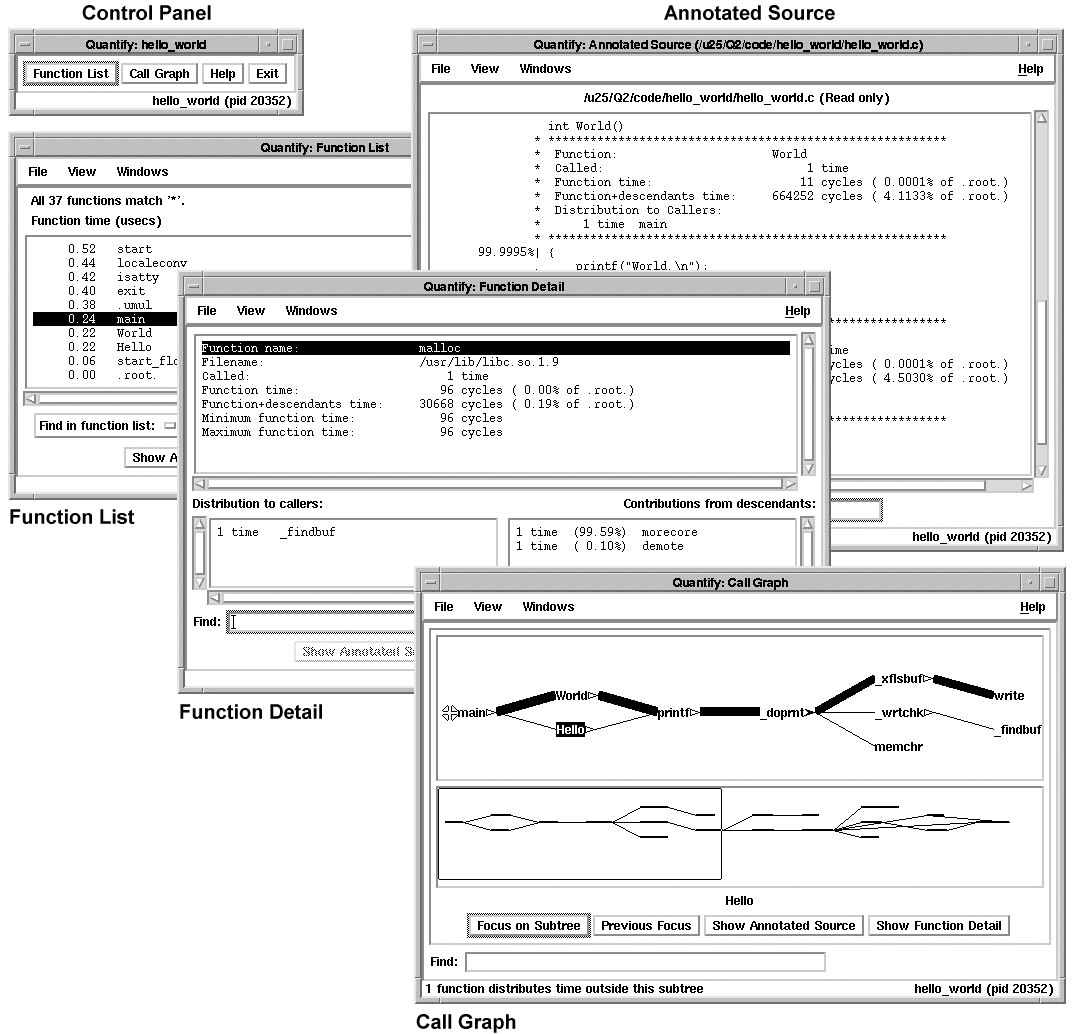
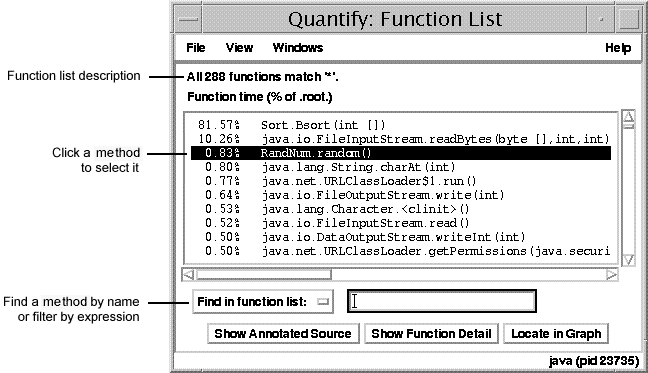
The Function List window shows all the functions that your program executed, sorted by their function time. This is the amount of time spent in the function.
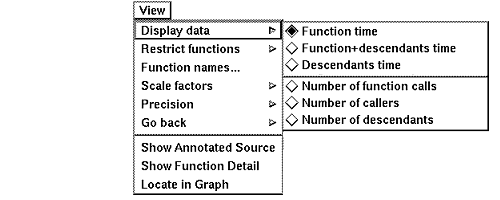
To sort the function list based on the various data Quantify collects, select View > Display data.
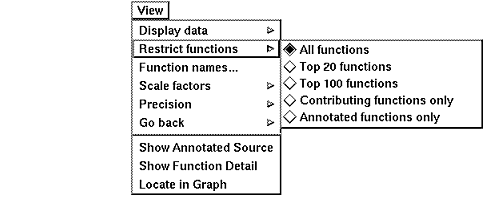
To focus on specific types of functions, or to speed up the preparation of the function list report in large programs, you can restrict the functions shown in the report. Select View > Restrict functions.
To search the function list for a specific function, type its name in the Find in function list entry field.

You can also use the Find in function list field to filter the function list. For example, searching for *str* will display only the methods that include the string str in their names.
 With
Java programs, you can filter the function list to find methods that
are defined on different
classes,
such as
sun.applet,
and that use certain
types in their
argument lists such as
(java.net.URL).
The Call Graph window presents a graph of the functions called during the run. It uses lines of varying thickness to graphically depict where your program spends its time. Thicker lines correspond directly to larger amounts of time spent along a path. This allows you to quickly discover the sources of bottlenecks.

 Methods executed by the Java
main thread are shown as descendants of the method
<classname>.main(java.lang.String[]).
To display the pop-up menu, right-click any function in the call graph.

You can use the pop-up menu to:
Use the pop-up menu to expand or collapse the subtrees of descendants for individual methods.

The Function Detail window presents detailed performance data for a single method and its contribution to the overall execution of the program.
For each method, Quantify reports both the time spent in the method's own code (its function time) and the time spent in all the functions that it called (its descendants time). Quantify distributes this accumulated function+descendants time to the function's immediate caller.

The function time and the function+descendants time are shown as a percentage of the total accumulated time for the entire run. These percentages help you understand how this function's computation contributed to the overall time of the run. These percentages correspond to the thickness of the lines in the call graph.
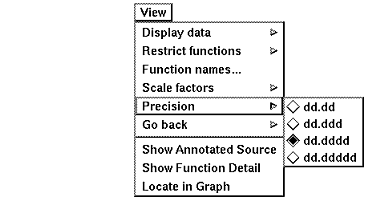
Quantify can display the recorded data in cycles (the number of machine cycles) and in microseconds, milliseconds, or seconds.
To change the scale of data, select View > Scale factors.

To change the precision of data, select View > Precision.
The Annotated Source window presents line-by-line performance data using the function source code.
The Annotated Source window is available only for class files that include line numbers.

The numeric annotations in the margin reflect the time recorded for that line or basic block over all calls to the function. By default, Quantify shows the function time for each line, scaled as a percentage of the total function time accumulated by the function.
To change annotations, use the View menu. You can select both function and function+descendant data, either in cycles or in seconds and as a percentage of the function+descendants time.

 Quantify for Java can
suppress package, subpackage, class, and argument list information
from method names. Quantify for Java does not suppress package and
class name information from argument types in the argument
list.
To open a dialog box for controlling how method names are displayed in the current Quantify window, select View > Function names .

To save the current data display to a binary .qv file (one that you can view in the Quantify user interface), or to save the data in export format (a text file suitable for processing by scripts), use the Save commands in the File menu.
 By default, Quantify
bases the name of the saved file on the program name you specify on
the command line. In the case of Java, the program name is not
your program, but rather the name
of the appliet viewer, Java executable, or container program that you
specified. You can change the name of the
file to identify your own Java code by using the Quantify
-filename-prefix
option.
 If you analyze a
dataset interactively in the Quantify user interface, Quantify does not automatically save the
displayed dataset, but you can save the
dataset from the File menu.
You can analyze a saved dataset by running qv, Quantify's data analysis program. To run qv, specify the qv option and the saved .qv file. For example, to analyze the dataset for the HelloWorld.23.qv file, type:
This displays the Quantify Control Panel from which you can open any data analysis window to analyze the saved dataset.
For a list of qv options that apply to Java, see Using Quantify options.
 The
qxdiff
script compares
two export data files from runs of a Quantify'd program and reports
any changes in performance. For Java programs, this script is useful
for detecting performance trends, but it does not provide repeatable output
as it does for C and C++ programs. This is because Quantify collects Java data
by timing, and not by counting cycles per machine instruction as it does for C/C++
programs.
To use the
qxdiff
script:
Use the
qxdiff
script to compare the two export
data files.
For
example:
% qxdiff testHash.pure.20790.0.qx improved_testHash.pure.20854.0.qx
The output from this example is as follows:

Quantify provides a control file (.quantify.java), run-time options, and API functions that help you control Quantify's behavior.
Quantify includes a file named .quantify.java, located in the <quantifyhome> directory, that helps you control the way Quantify profiles Java code.
You can can define directives in .quantify.java to set prefilters. These prefilters prevent Quantify from collecting data you don't want to consider and, as a consequence, improve the performance of your code as it runs under Quantify. The file also includes directives for setting options and identifying methods that block and methods that wait. For specific information and examples of directive formats, refer to the documentation provided in the .quantify.java file.
Quantify looks for this file in your current working directory and in your home directory, as well as in <quantifyhome>. You can copy the file to your working directory or home directory, and modify it with directives specific to your current project. The file in your current working directory takes precedence over the file in your home directory. These two files take precedence over the file in the quantifyhome directory.
 You can specify Quantify options for Java programs in the following ways,
listed in order of highest to lowest precedence.
Note that the options precedence for Java programs differs from the options precedence for C and C++ programs, which is documented in the Quantify online help system.
By default, Quantify tracks the total time for each function call and displays this data in the Function Detail window. Quantify also reports information about individual lines when debugging information is available.
To specify the level of granularity for code that contains debugging information, use the -collection-granularity option. Quantify recognizes the values function and line for Java profiling.
For example, to collect data at method granularity for an applet, type (on csh):
% setenv
QUANTIFYOPTIONS -collection-granularity=method
% quantify -java <applet viewer> <html file>
 The following tables show which Quantify options you can
use for profiling Java code. (Quantify ignores the
options that are relevant only to C and C++ code when profiling Java code.)
For further information about options, see the Quantify online help system.
Runtime options:
| -always-use-cache-dir | yes |
| -cache-dir | yes (Quantify does not generate instrumented files for Java. The cache directory is used only for the .machine.map file.) |
| -collection-granularity | yes |
| -collector | not relevant |
| -forbidden-directories | not relevant |
| -force-rebuild | not relevant |
| -g++ | not relevant |
| -ignore-runtime-environment | not relevant |
| -linker | not relevant |
| -print-home-dir | yes |
| -use-machine | not relevant |
| -version | yes |
qv options:
| -add-annotation | yes |
| -print-annotations | yes |
| -windows | yes |
| -write-export-file | yes |
| -write-summary-file | yes |
Data Collection options:
| -avoid-recording-system-calls | not relevant |
| -measure-timed-calls | yes |
| -never-record-system-calls | not relevant |
| -record-data | yes |
| -record-dynamic-library-data | not relevant |
| -record-register-window-traps | not relevant |
| -record-system-calls | not relevant |
| -report-excluded-time | not relevant |
Threads options:
| -max-threads | yes |
| -save-thread-data | yes |
| -threads | yes |
| -thread-stack-change | not relevant |
Options for saving data:
| -filename-prefix | yes |
| -write-export-file | yes |
| -write-summary-file | yes |
Options for saving data on signals:
| -api-handler-signals | yes |
| -handle-signals | not relevant |
| -ignore-signals | not relevant |
| -save-data-on-signals | yes |
Options for automating data analysis:
| -run-at-exit | yes |
| -run-at-save | yes |
| -windows | yes |
Output options:
| -append-logfile | yes |
| -copy-fd-output-to-logfile | yes |
| -logfile | yes |
| -output-limit | yes |
Miscellaneous run-time options:
| -auto-mount-prefix | not relevant |
| -fds | yes |
| -program-name | yes |
| -record-child-process-data | not relevant |
| -user-path | yes |
Help system display options:
| -pure-help-max-wait | yes |
 Calling PureAPI
methods
PureAPI methods let you control Quantify's data collection during program execution. You can call these methods from a debugger or call them directly from your Java program code.
To call an API method, use the following syntax:
Rational.PureAPI.IsRunning()
or
import Rational.PureAPI;
. . .
PureAPI.IsRunning()
PureAPI is a Java class that includes all the API methods that can be used with Quantify when profiling Java code. The PureAPI class is part of a Java package called Rational.jar, which is located in <quantifyhome>. You can run class files that include calls to PureAPI methods with or without Quantify. When you run a class file with Quantify, Quantify automatically sets CLASSPATH and LD_LIBRARY_PATH to access Rational.jar and libQProgJ.so. When you run the class file without Quantify, you must add <quantifyhome>/lib32 to your LD_LIBRARY_PATH. If you do not have a Rational.jar file in your <javahome>/jre/lib/ext directory, you must add <quantifyhome> to your CLASSPATH.
The PureAPI methods are as follows:
Reports whether Quantify is running.
Returns
true
if the executable is instrumented
Disables collection of all data by Quantify.
CAUTION: Once you call this function, you cannot re-enable data
collection for this process. No data is recorded and no data is
transmitted. The program is modified to incur the minimum overhead
when disabled.
This function always returns
true.
Tells Quantify to start recording all program performance data.
By default, an instrumented program starts recording data automatically.
Using option
-record-data=yes
is like calling this function before your program begins executing.
The function returns
true
if it changed the state of Quantify
data recording, and
false
otherwise.
Tells Quantify to stop recording all program performance data.
You can turn off native method timing separately using the other
functions below.
Using option
-record-data=no
is like calling this
function before your program begins executing.
The function returns
true
if it changed the state of Quantify
data recording, and
false
otherwise.
Checks if Quantify is currently recording all program performance data.
Tells Quantify to clear all the data it has recorded about
your program's performance to this point. You can use this function,
for example, to ignore the performance of the startup phase of your program.
This function always returns
true.
Saves all the data recorded since program start
(or the last call to
clearData()) into a dataset (a
.qv
file).
Note:This function calls
clearData()
after saving the data.
This function returns
true
if successful, and
false
otherwise.
Tells Quantify to save the argument string in the
next
output datafile written by
saveData()
(the datafile
corresponding to the current part of the program's run). These annotations
can be viewed later using the
qv
program. The function is typically used
to mark datafiles with important information about how the data was
recorded (e.g., what the program arguments were, who ran the program, or
what datafiles were used).
This function returns the length of the string, or 0 if it is passed a
null reference.
public static int IsRunning();
public static int DisableRecordingData();
public static int StartRecordingData();
public static int StopRecordingData();
public static int IsRecordingData();
public static int ClearData();
public static int SaveData();
public static int AddAnnotation(String annotation);
These API methods can also be used with Rational PureCoverage, Rational Software's coverage monitoring tool.