Current Deep Thunder Forecast for Greater Austin and San Antonio Metropolitan Areas

Products for Weather-Sensitive Operations

Click on any of the 17 images below to see and/or interact with
these model forecast products at 2 km resolution. They show forecasted information
in Greater Austin and San Antonio Metropolitan Areas.
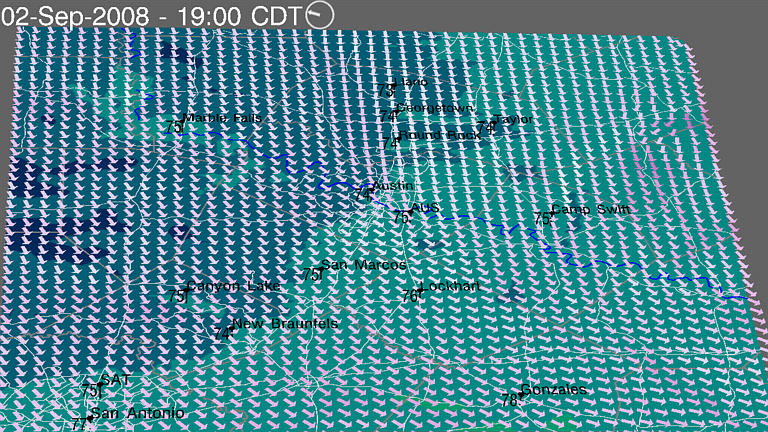
The first focuses on temperature and winds,
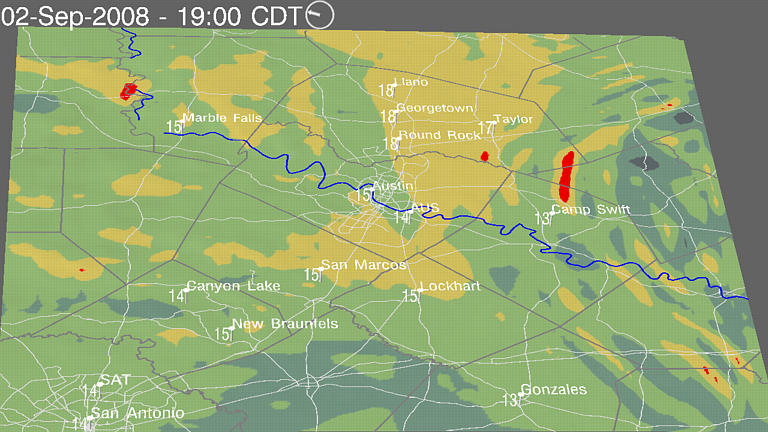
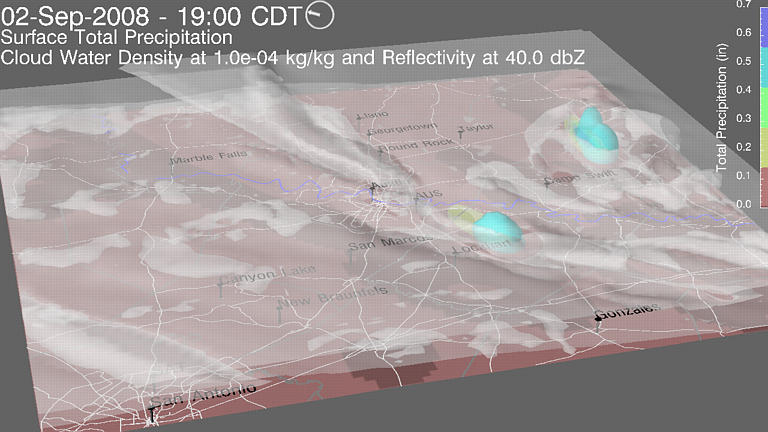
the second focuses on winds only, and the third focuses on clouds and precipitation.
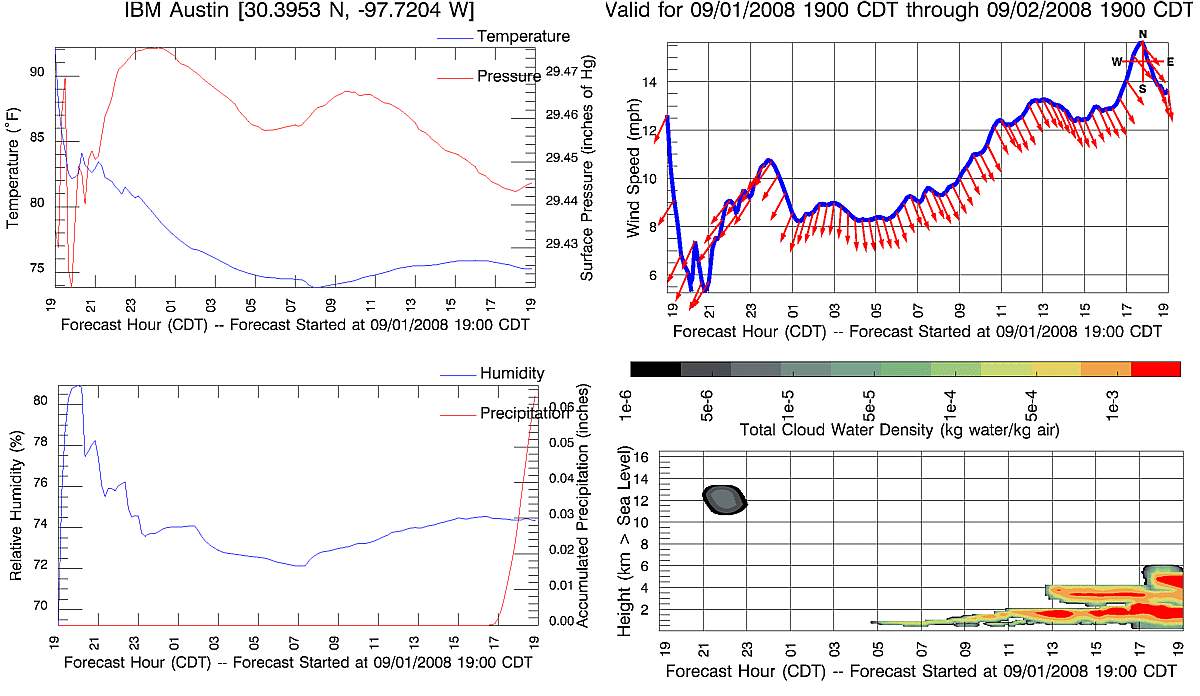
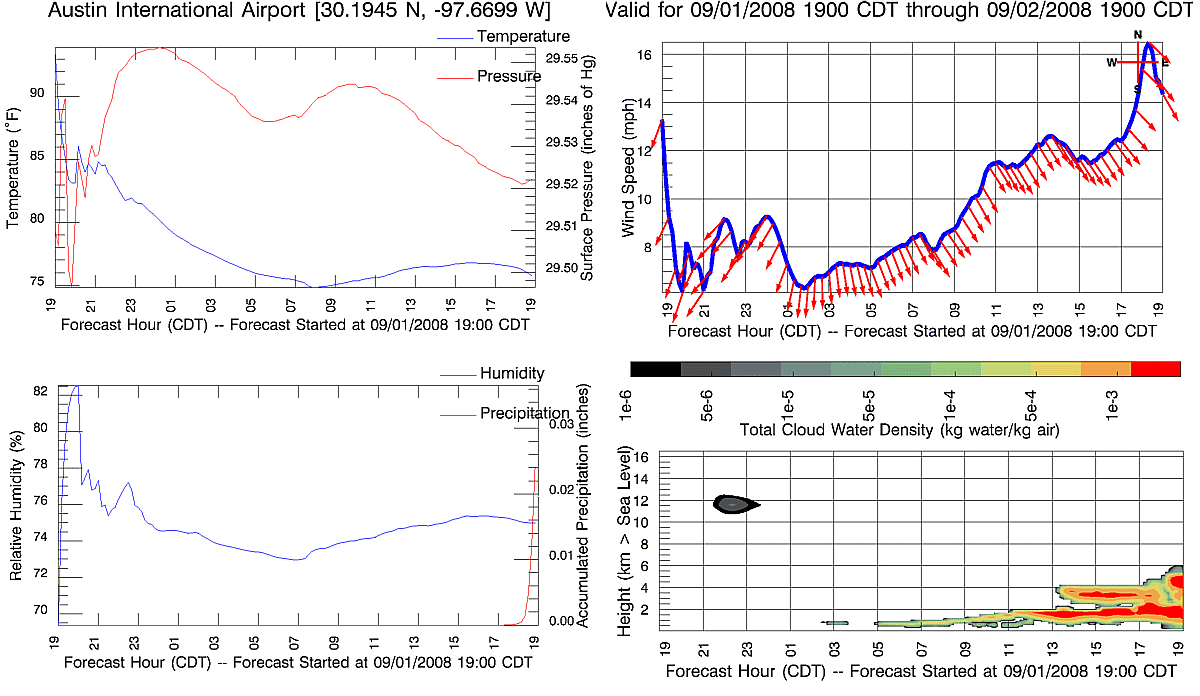
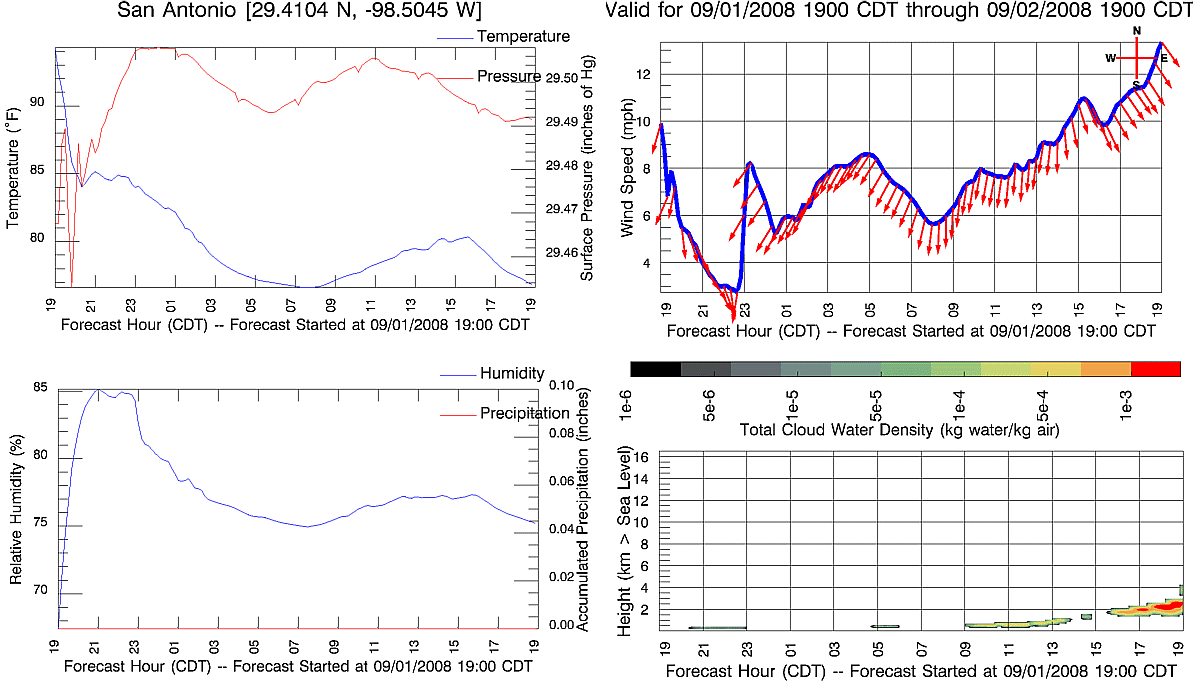
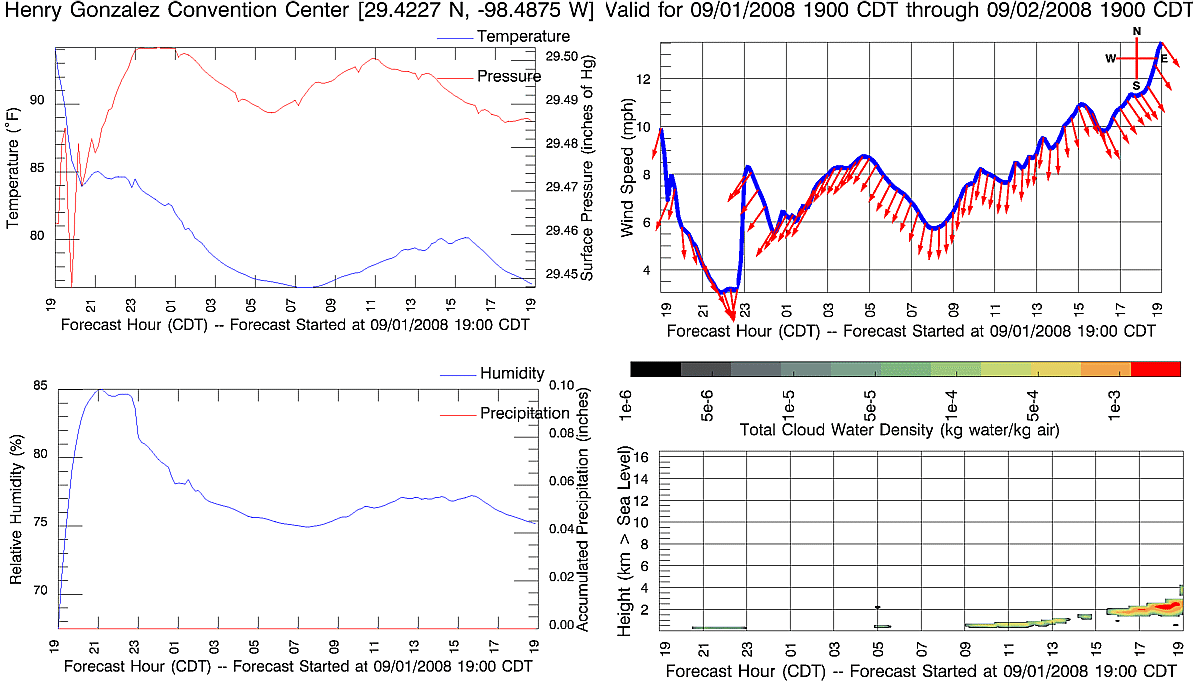
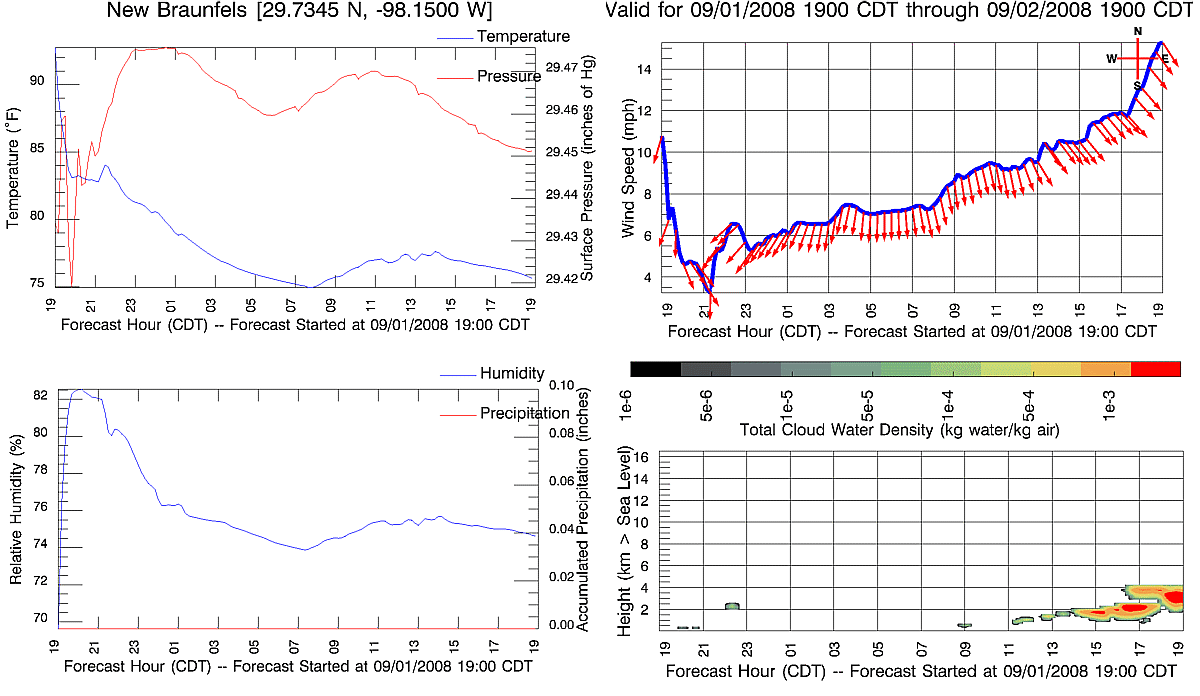
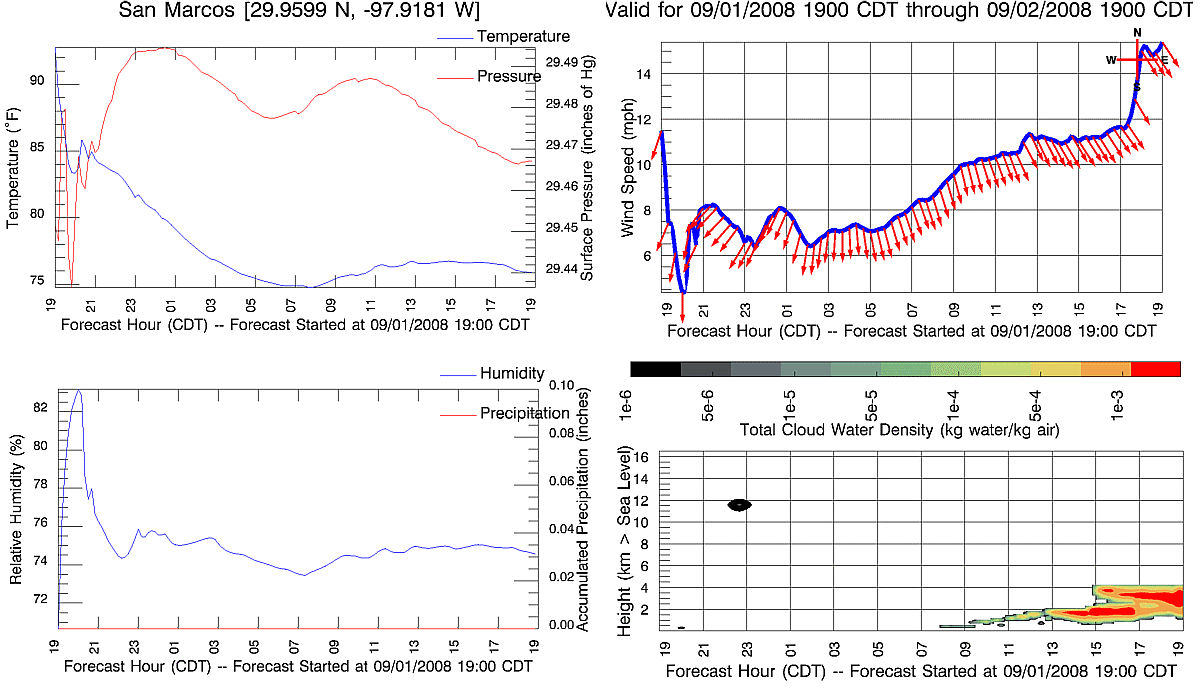
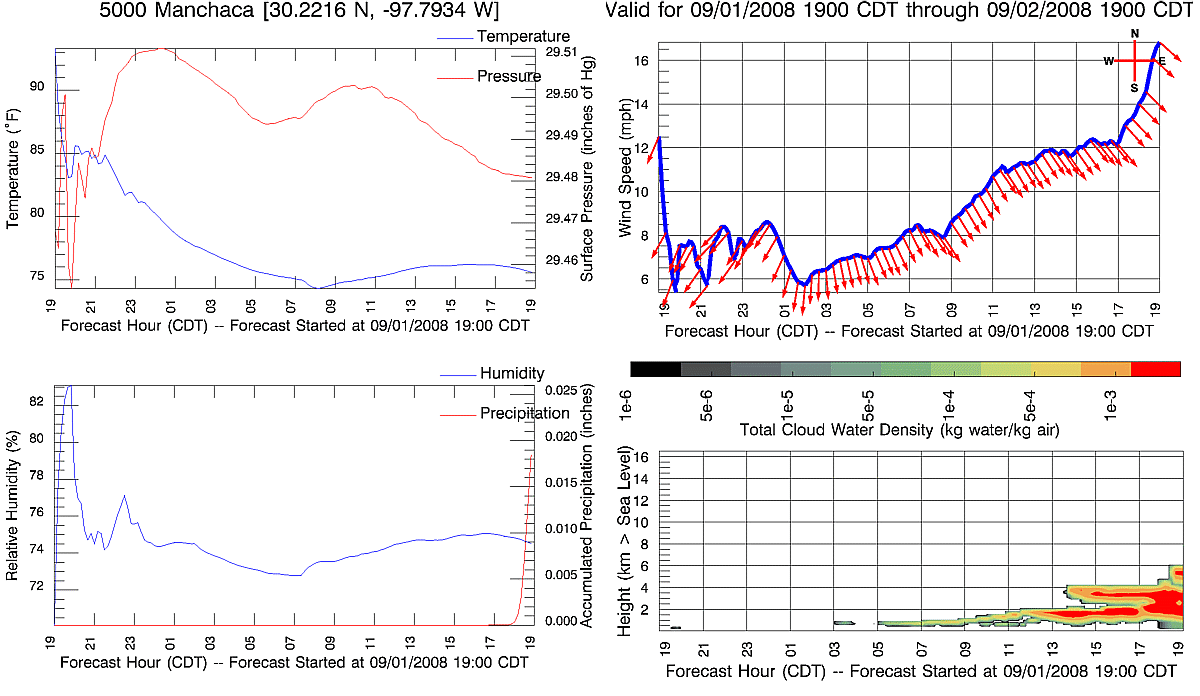
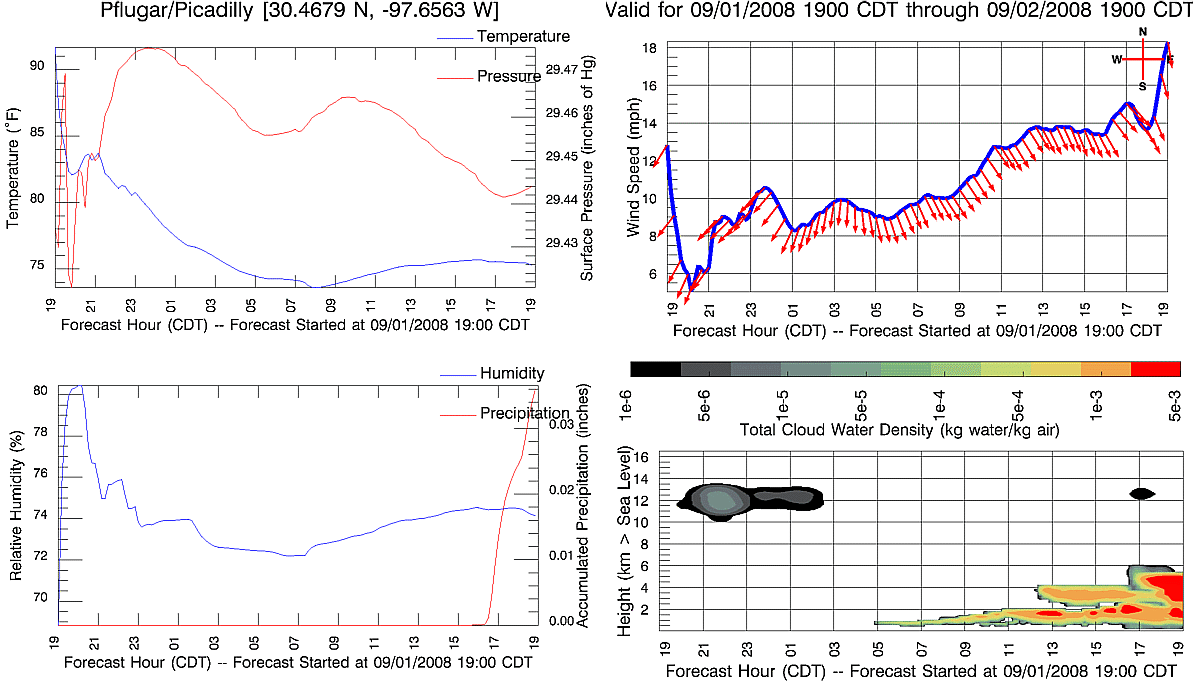
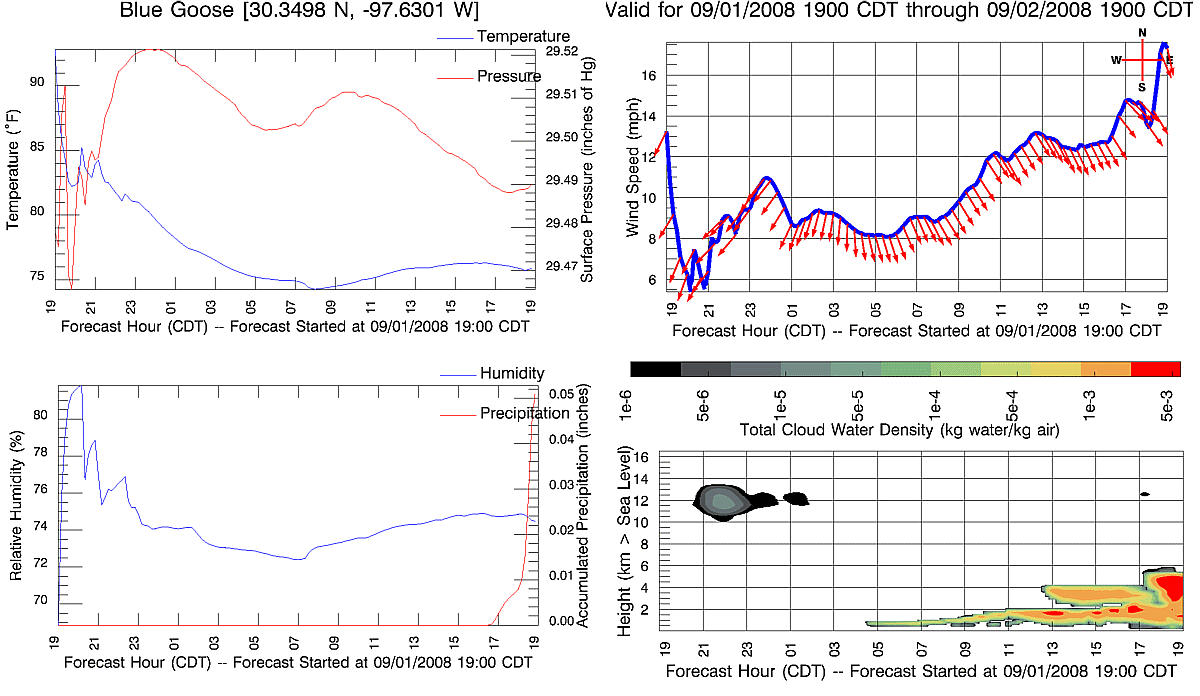
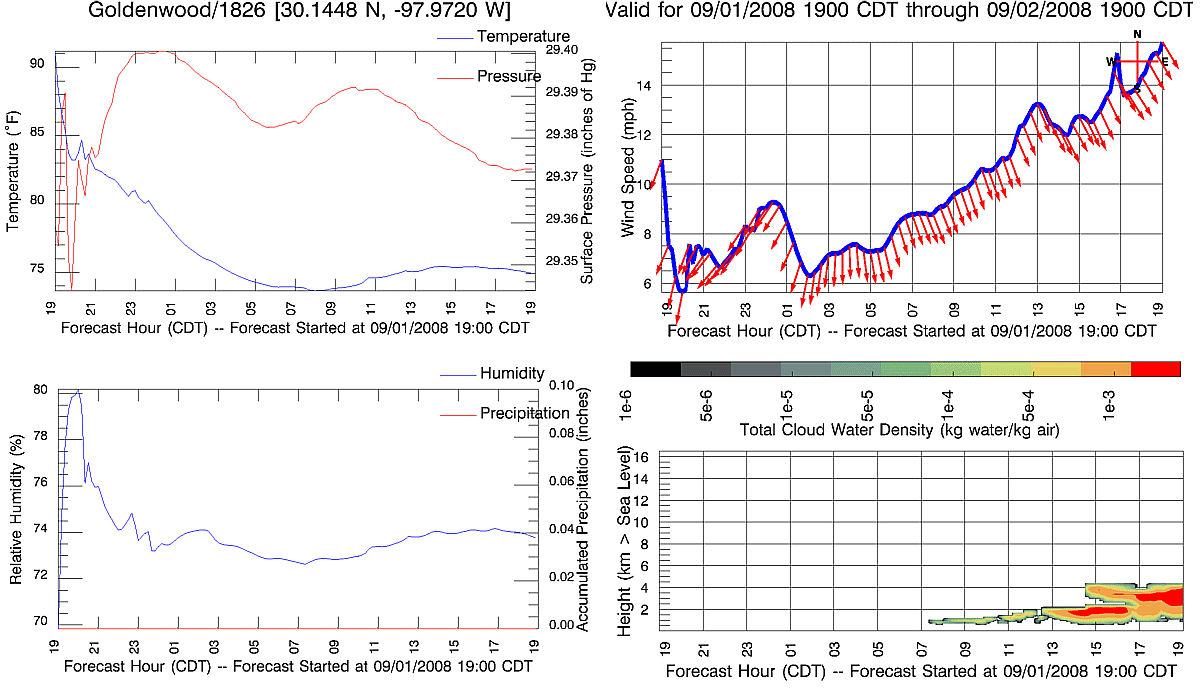
The fourth through the 17th illustrate clouds and surface conditions for various locations
around this region including several cities and their airports,
respectively, via a set of four-panel plots.
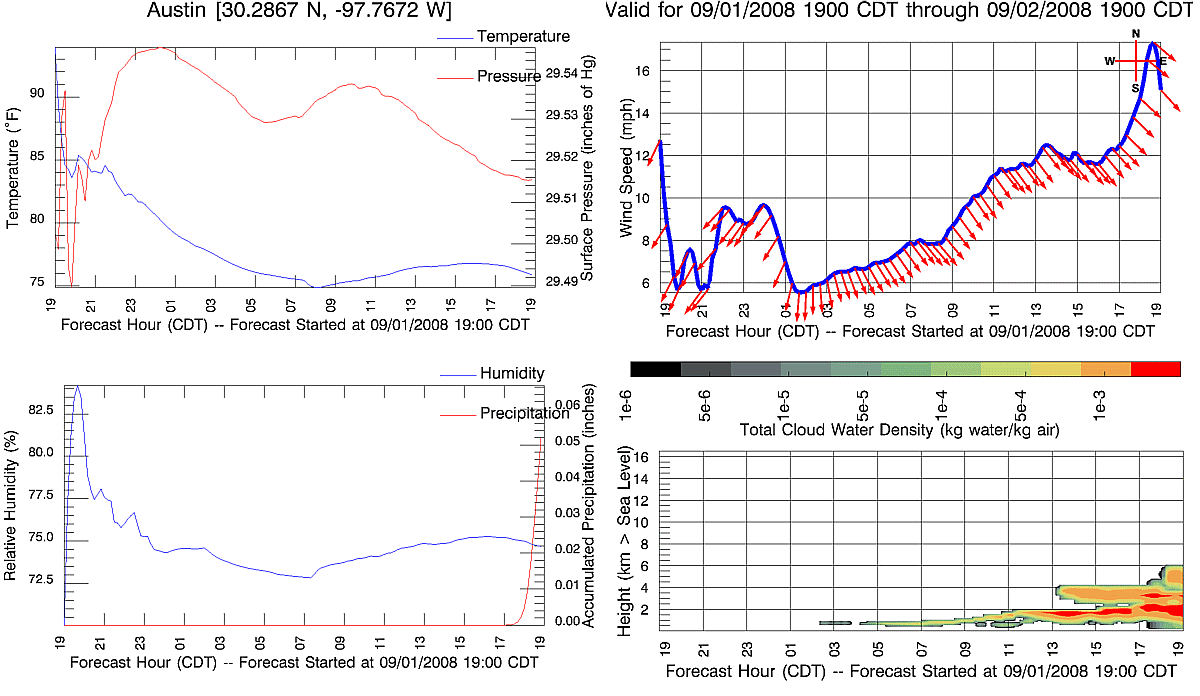
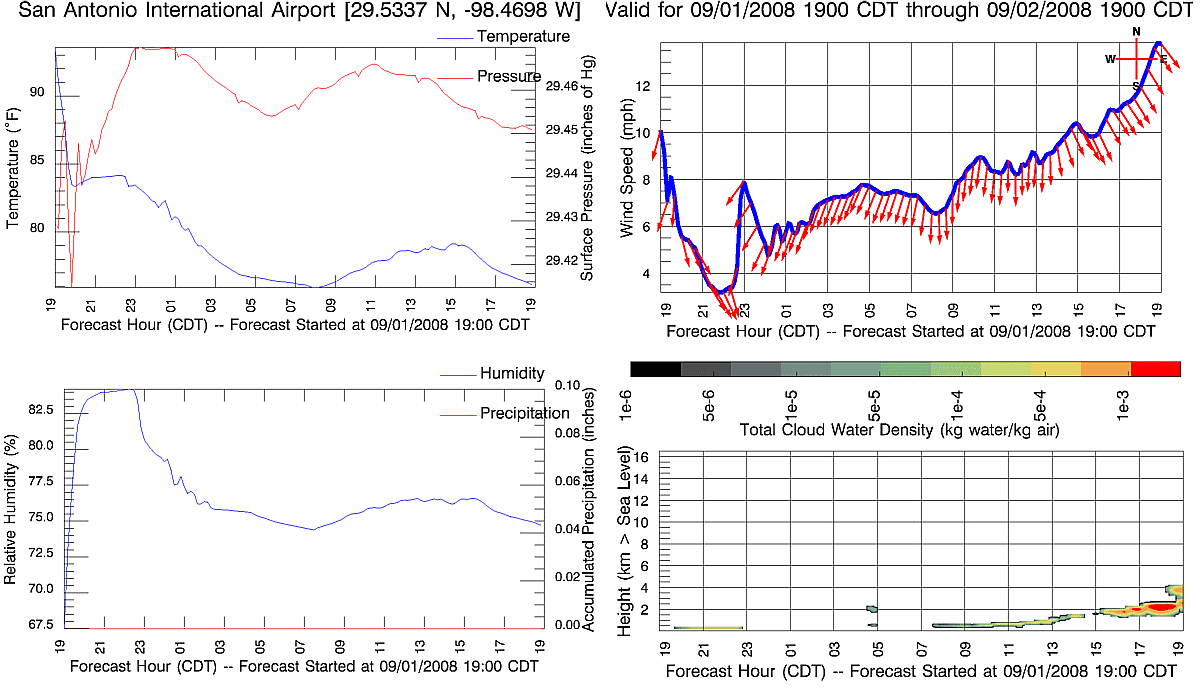
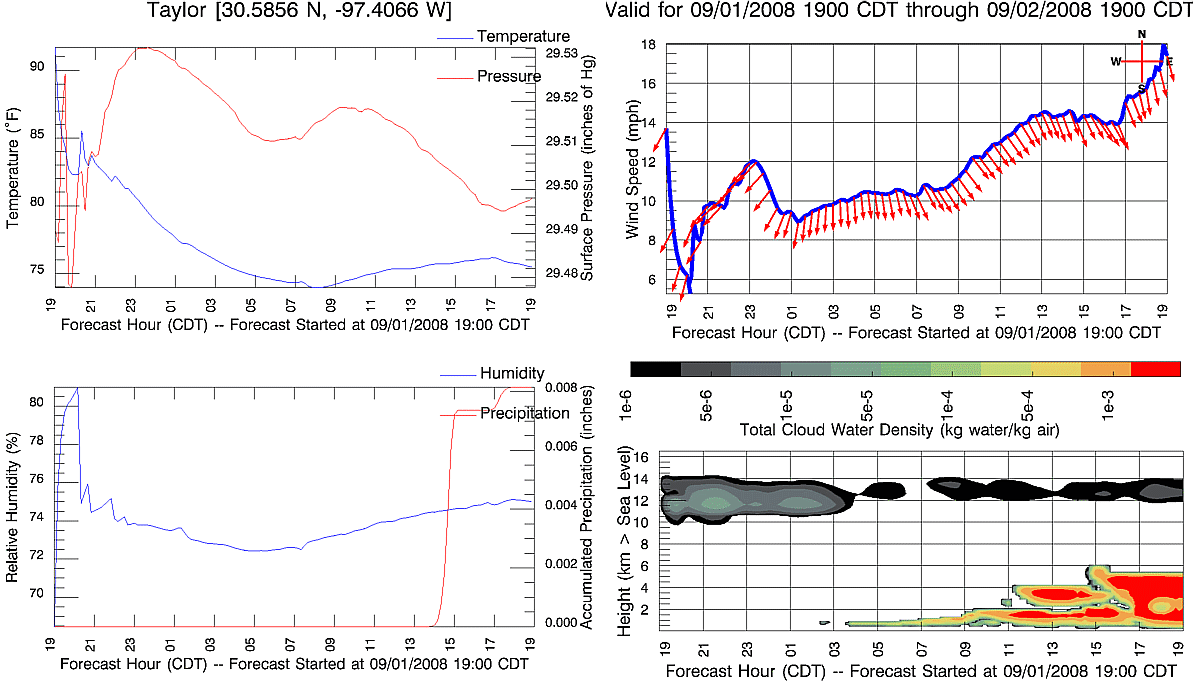
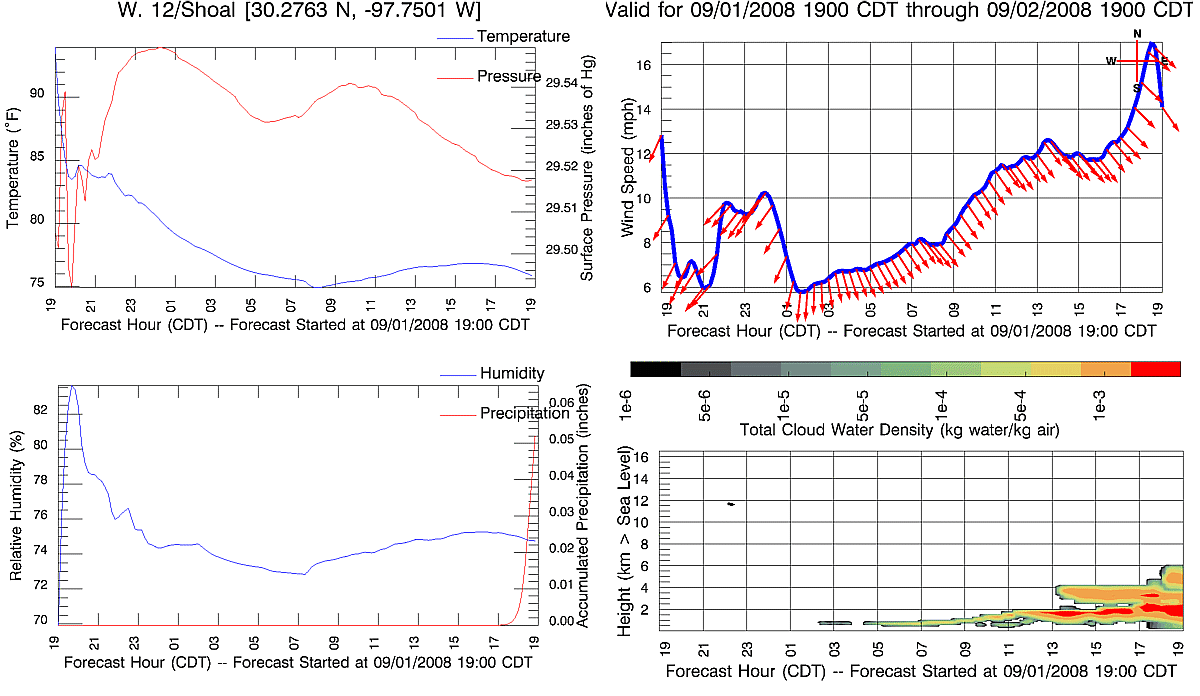
There are a number of forecasted weather variables shown in the four
panels for each of the 14 plots below as determined from the model using the highest resolution
data computed (2 km) as a function of time for the forecast period.
The plots on the left each show two variables
while the plots on the right each show one. The top left plot presents
temperature (blue) and pressure (red).
If the temperature range includes the freezing point of water, the plot will be marked
with a horizontal black line at 32 degrees Fahrenheit.
The bottom left panel shows humidity
(blue)
and precipitation (red). Since the precipitation
is accumulated through the model run, the slope of the curve will be indicative
of the predicted rate of precipitation. Therefore, when the slope
is zero, it is not raining (or snowing). In addition, the model calculations
require some time to "spin-up" the microphysics to enable precipitation.
Therefore, there will typically be no precipitation in the first couple
of hours of model results.
The top right plot illustrates forecasted winds -- speed
(blue) and direction (red).
The wind direction is shown via the arrows that are attached to the wind
speed plot. The arrows indicate the predicted (compass) direction
to which the wind is going. The bottom right plot is a colored contour
map of forecasted total (water and ice) cloud water density as a function
of elevation and time. This "cross-sectional" slice can provide information
related to storms, fog, visibility, etc. predicted at this location.
Portions of the plot in white imply time or elevations where there are
little or no clouds. Areas in yellow, orange and red imply when and
where the relatively densest clouds are forecasted, following the color
legend on the top of the panel.
Click on any of the plots to display a full-size version.
You can learn more about this technology, relevant data
and weather forecasting, at the following sites:
Learn
More about Deep Thunder
Learn
More about how Deep Thunder Visualizes the Data Generated by the
Weather Model
Current Weather Information and
Predictions for Austin/San Antonio, TX (from the National Weather Service)
Current Model Results from the
National Weather Service
This web site provides visual representations of these
forecasts on an experimental near-real-time basis. These visualizations
are provided as-is with no guarantee as to their quality or reliability.
IBM bears no responsibility or liability concerning the accuracy or availability
of these visualizations as their production depends on many external factors.
Although they are provided without direct interpretation, the underlying
forecasts and the visualizations will continue to evolve in an effort to
refine the technology, usability and the science as well as to understand
their potential value for both businesses and consumers.
lloydt@us.ibm.com