Current Deep Thunder Forecast for New York

Products for Consolidated Edison Operations

Click on any of the seventeen images below to view
clouds and surface conditions for various locations in
New York City, Westchester County, Rockland County or Orange County
via a set of four-panel plots.
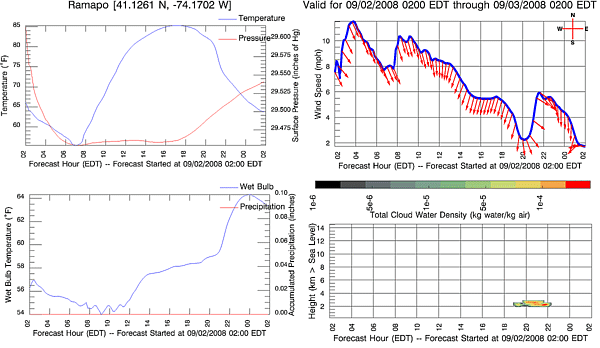
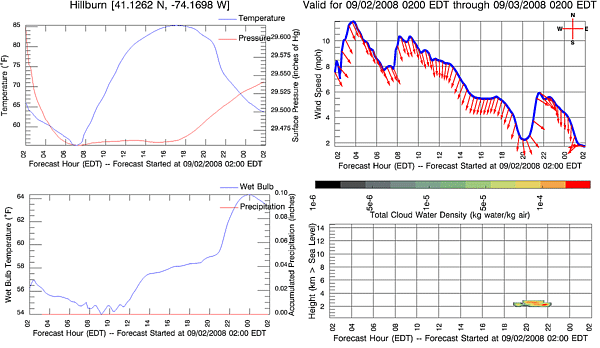
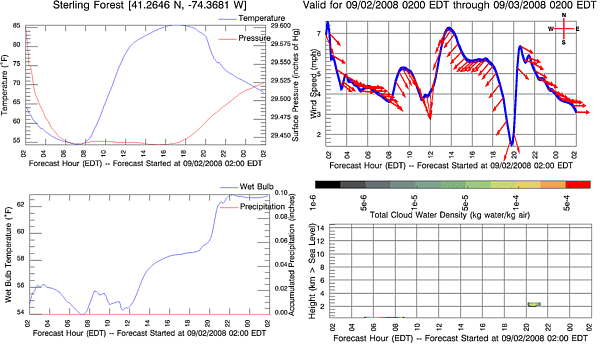
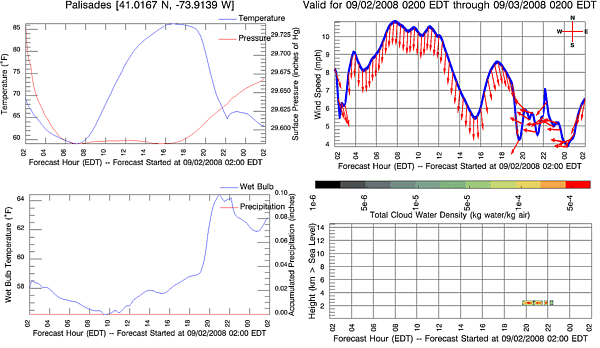
There are a number of forecasted weather variables shown in the four
panels for each of the plots below as determined from the model
for as a function of time
for the forecast period.
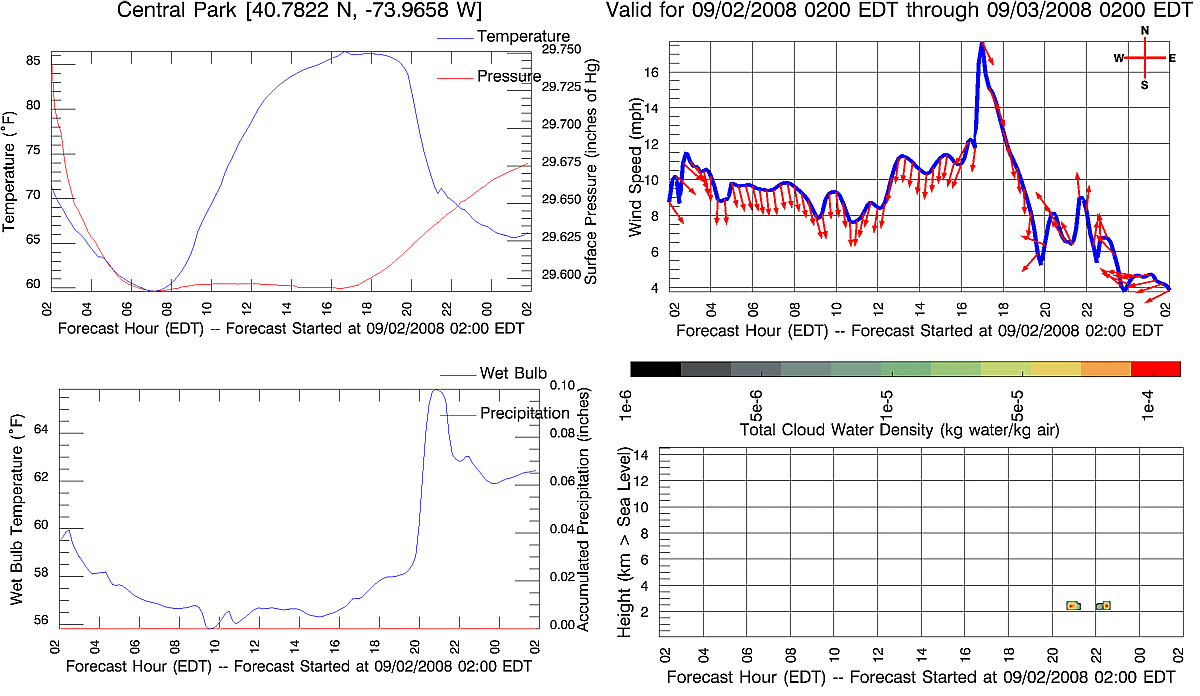
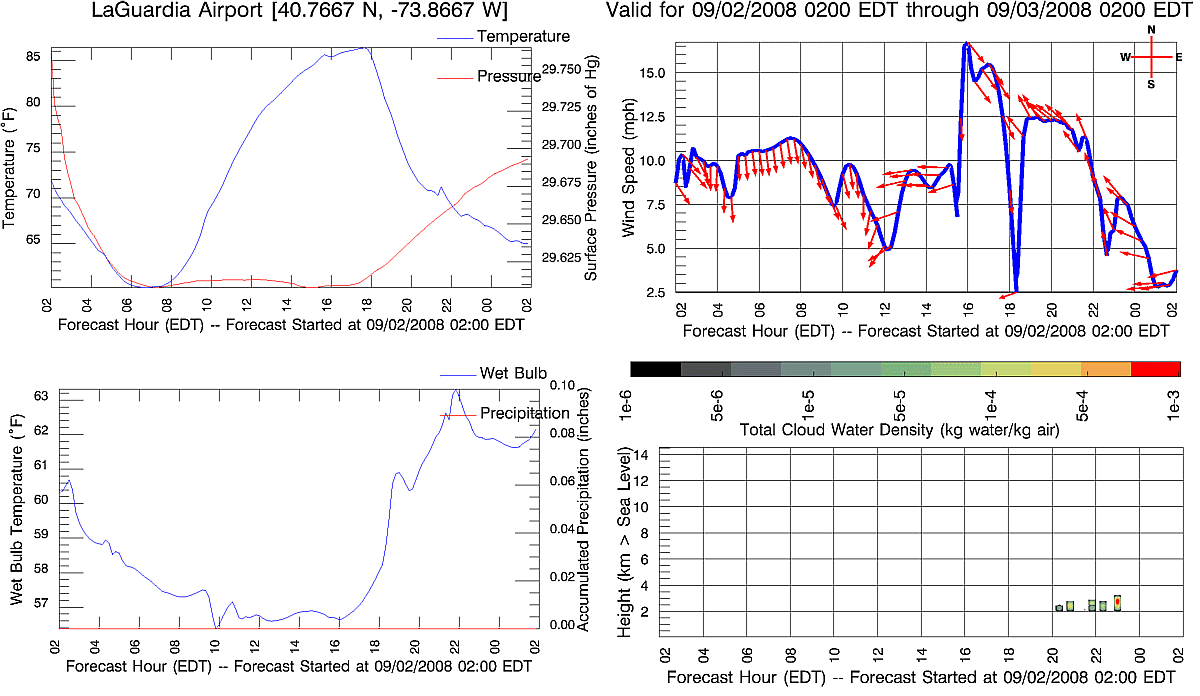
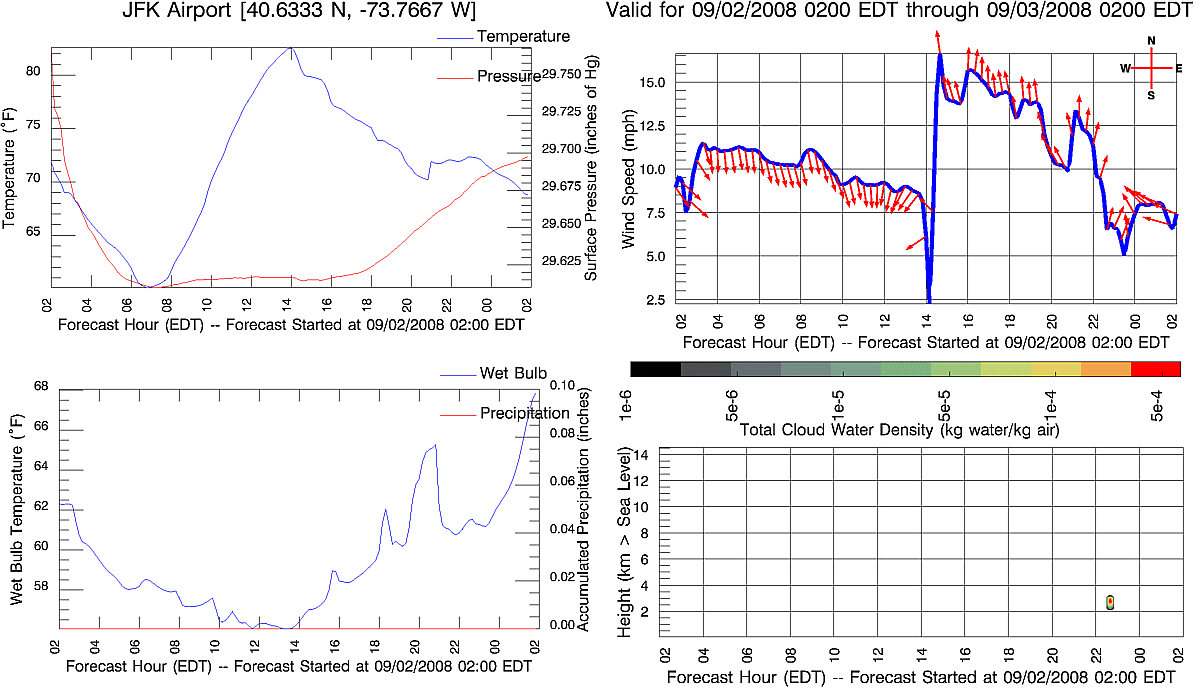
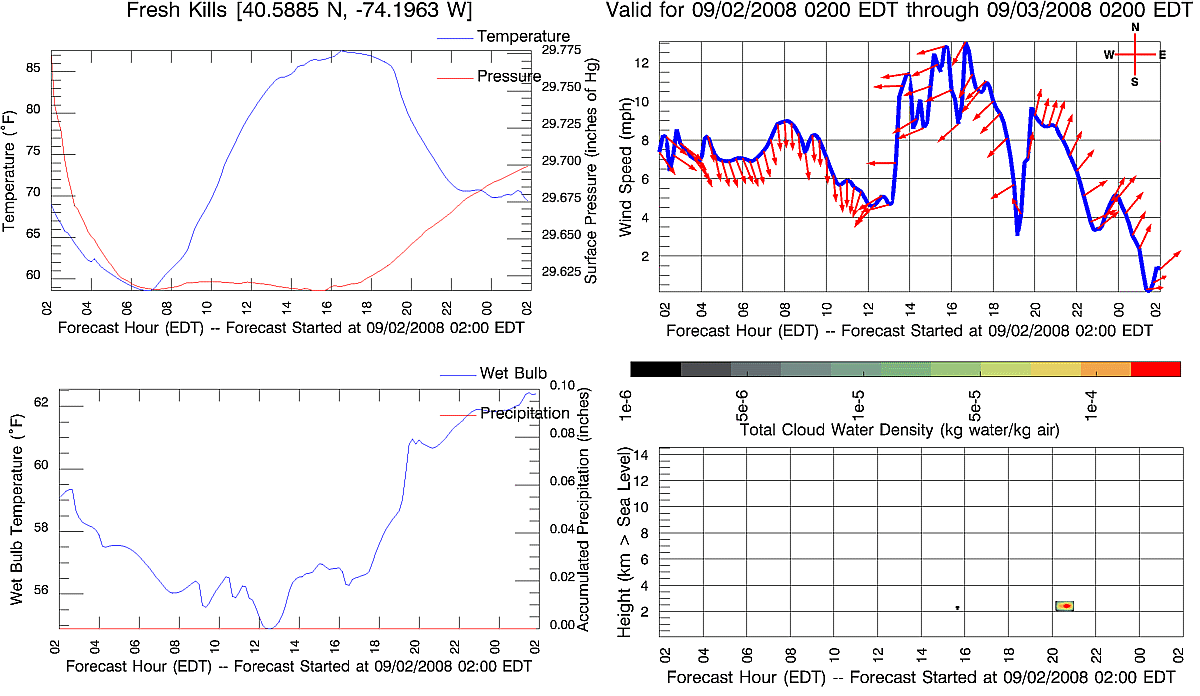
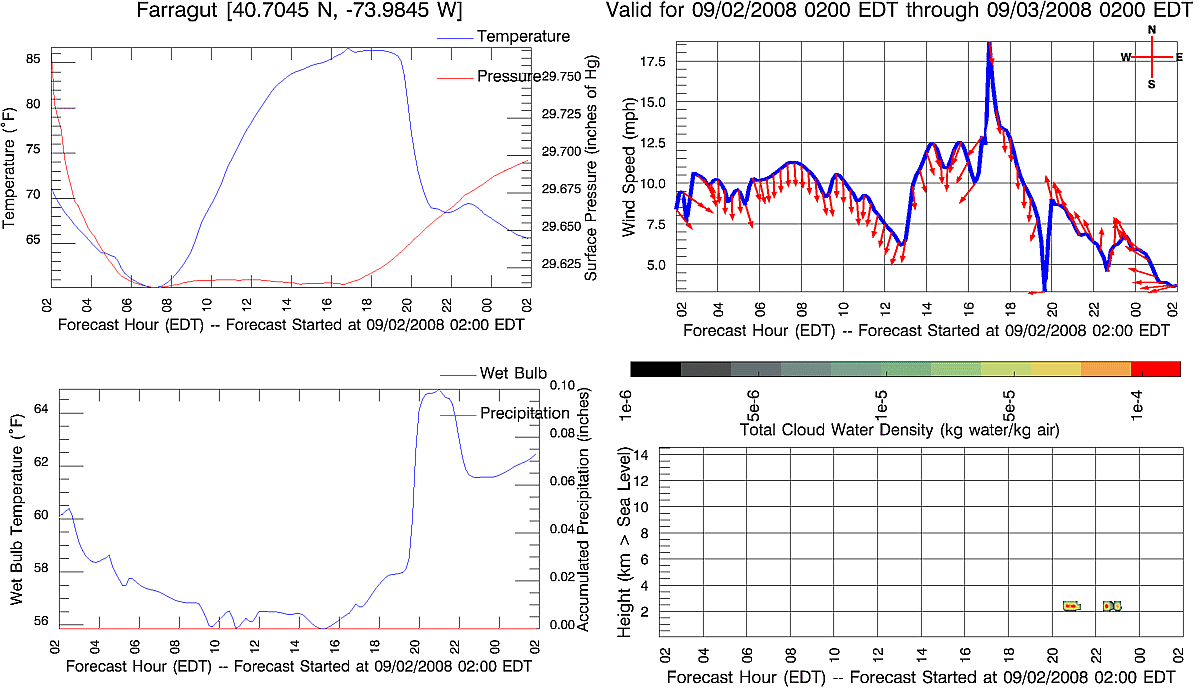
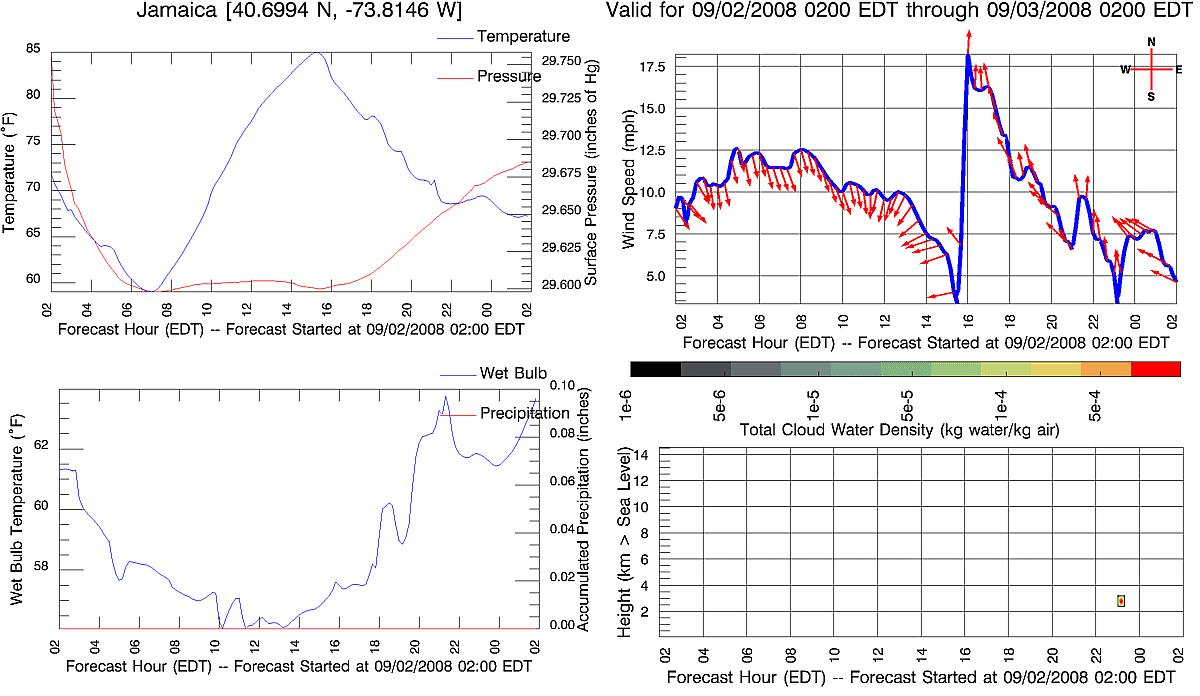
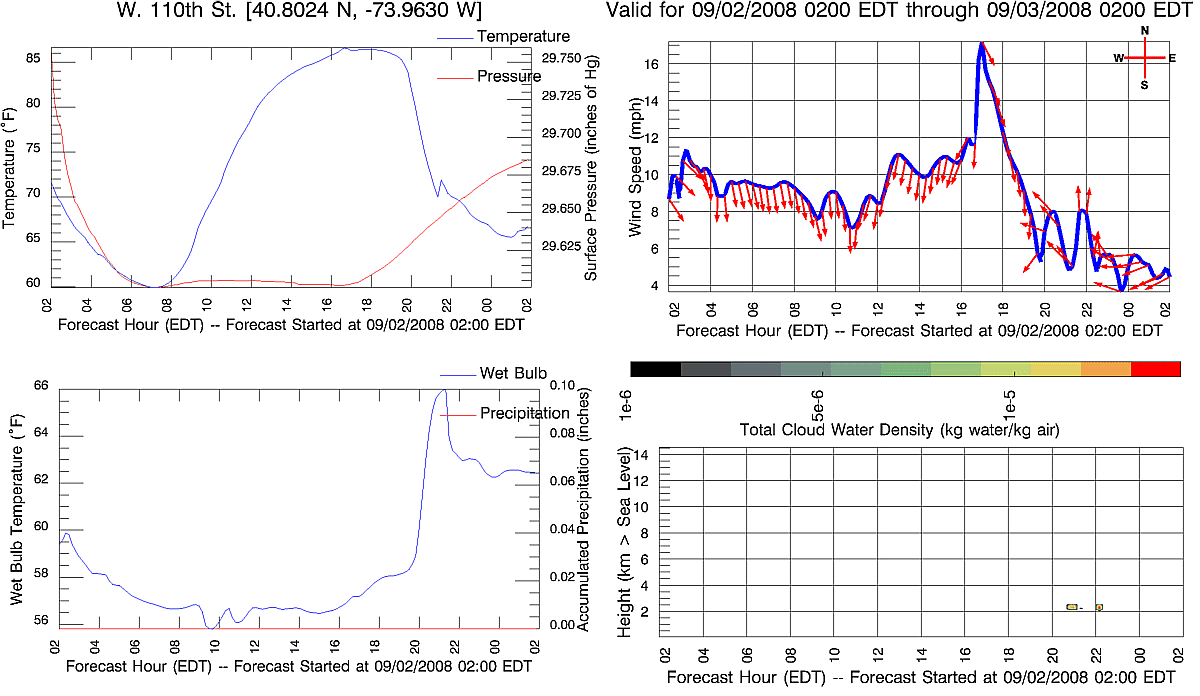
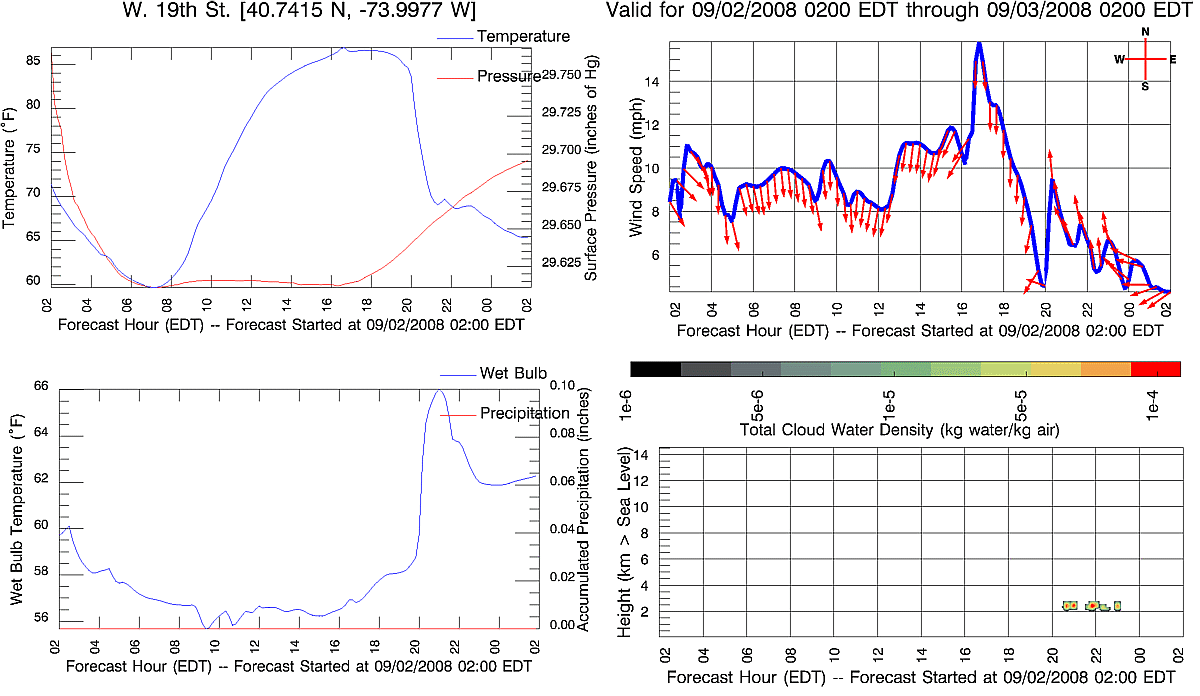
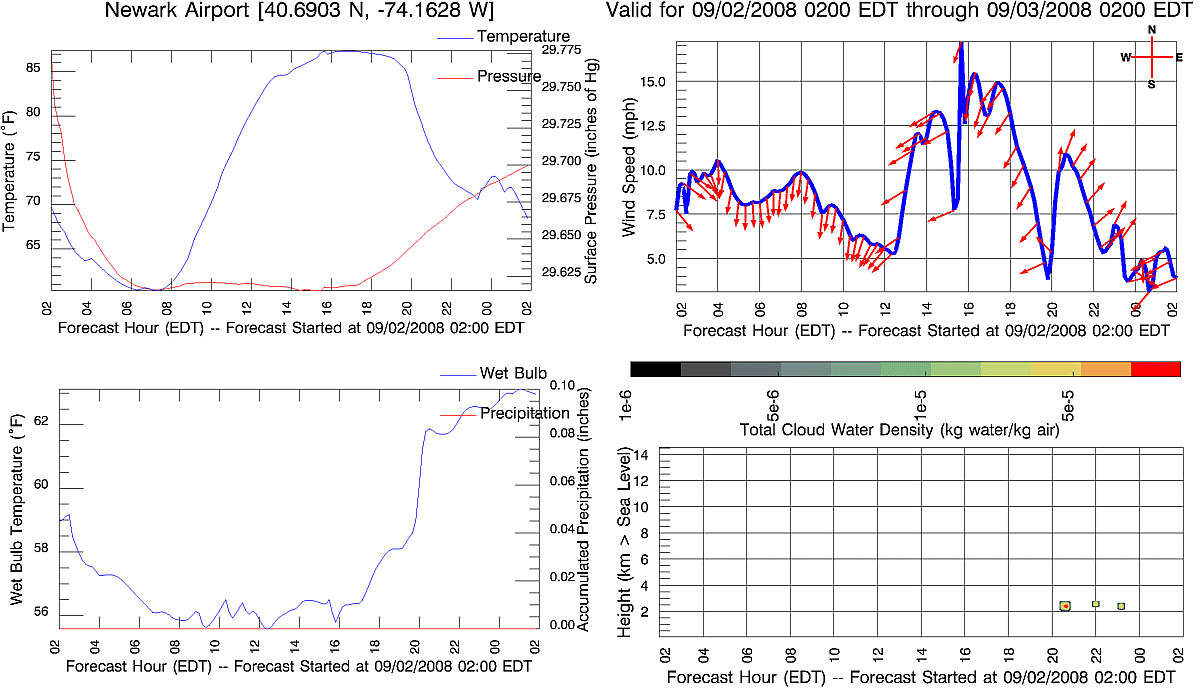
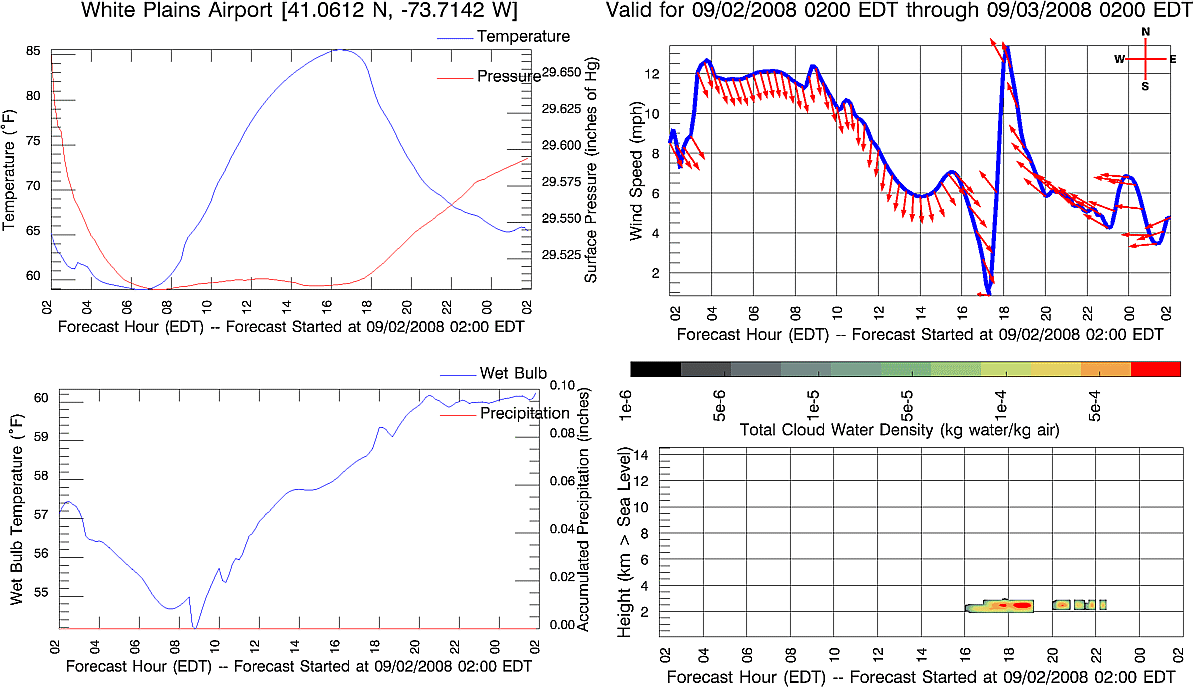
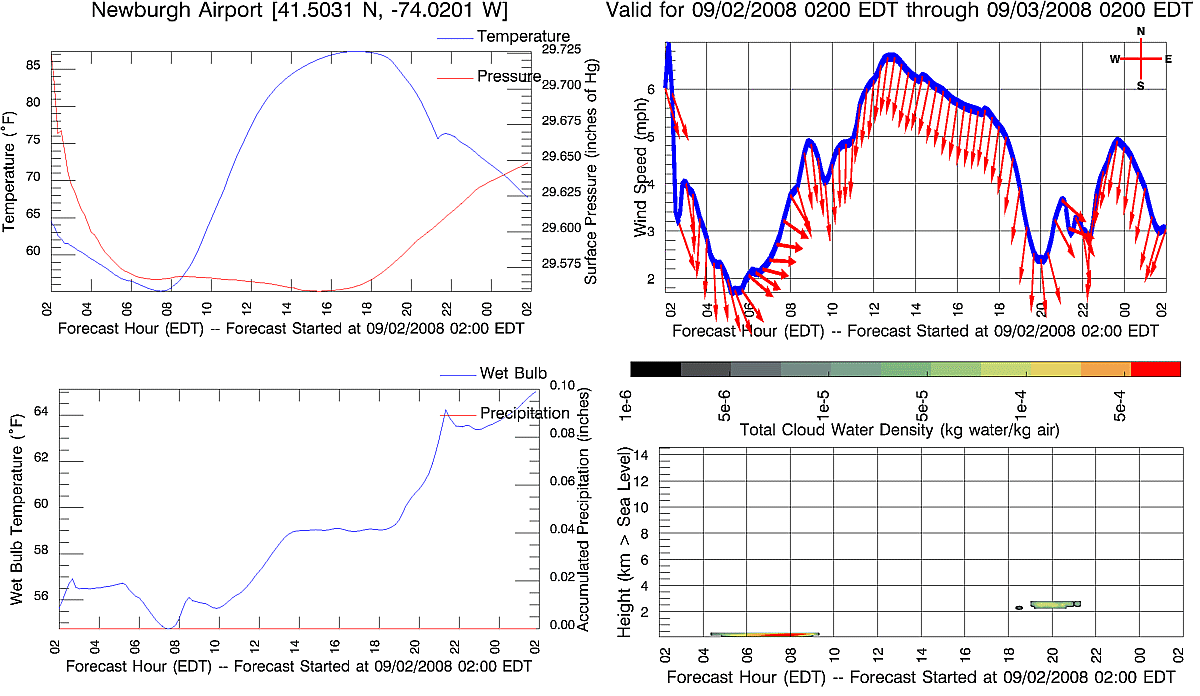
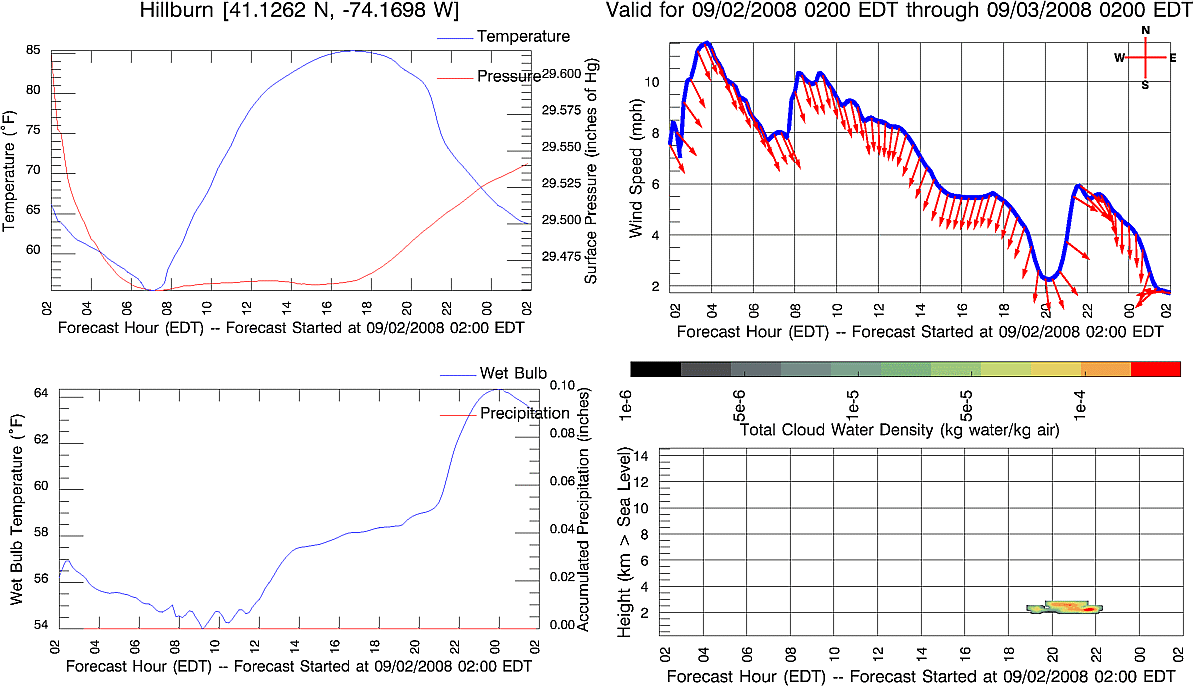
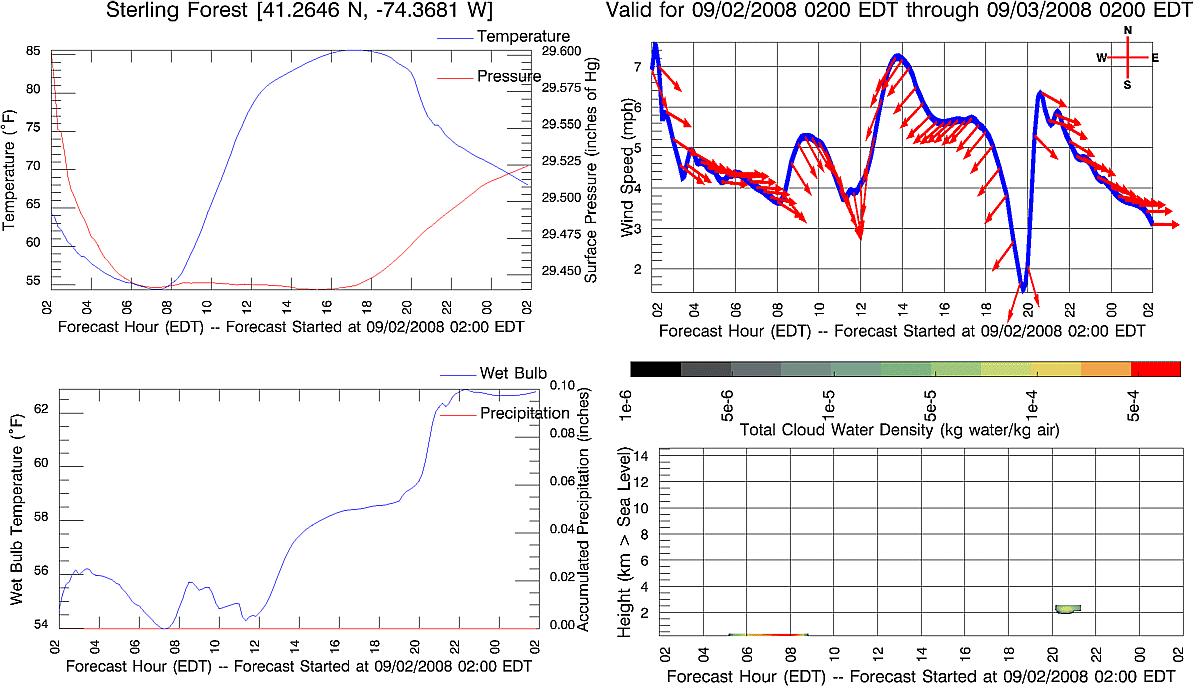
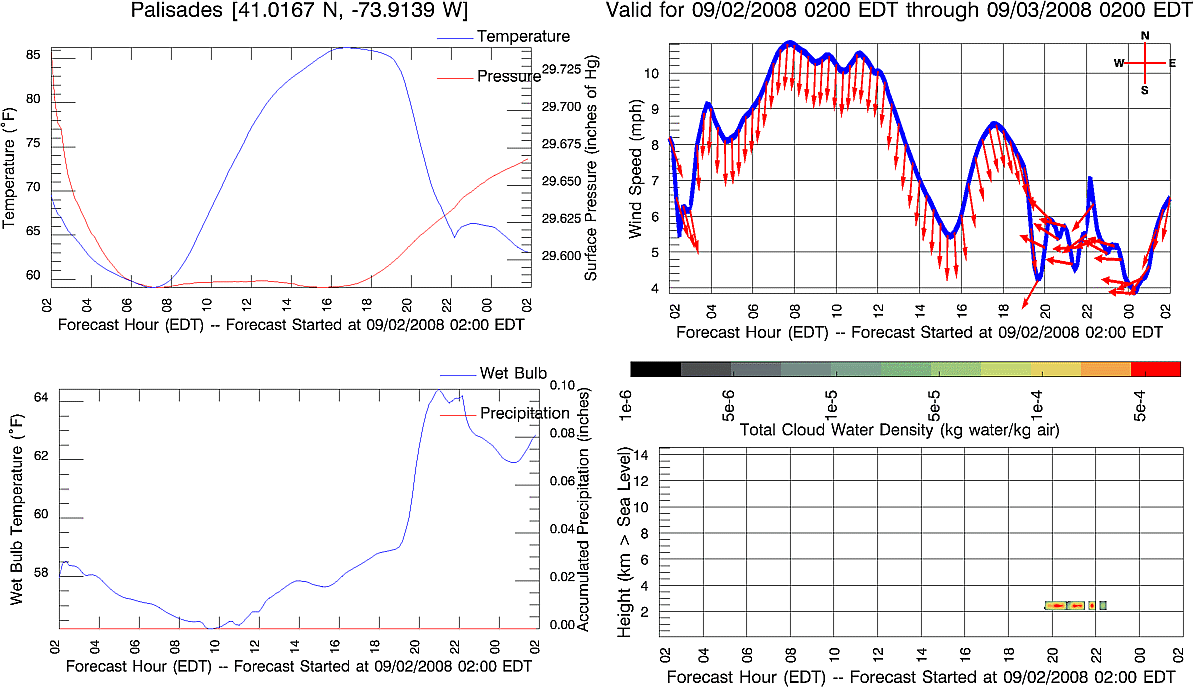
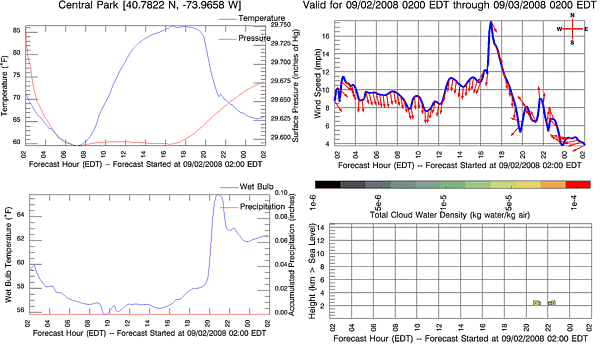
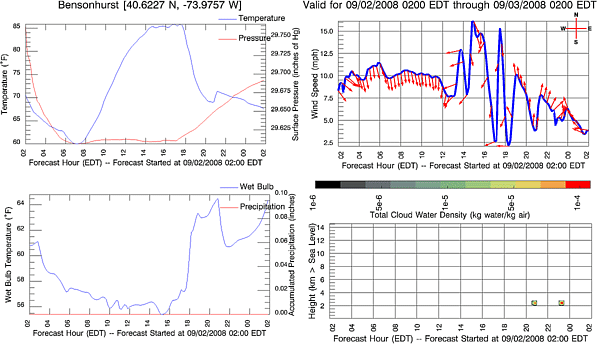
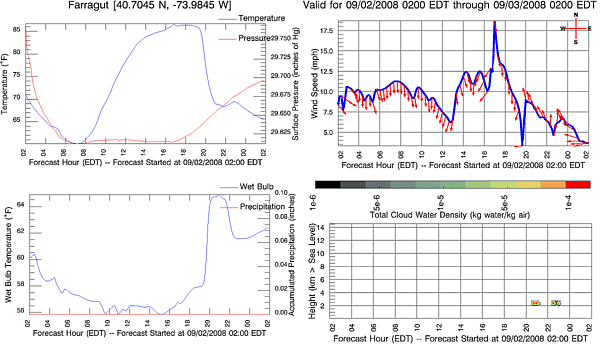
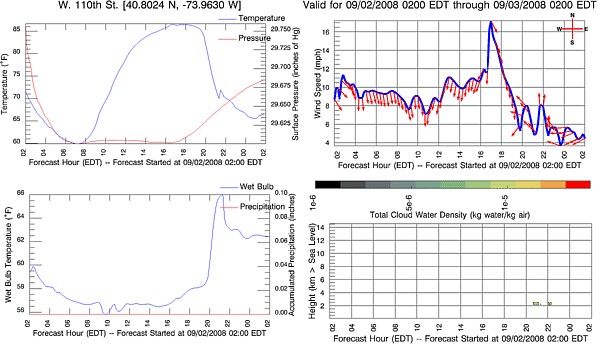
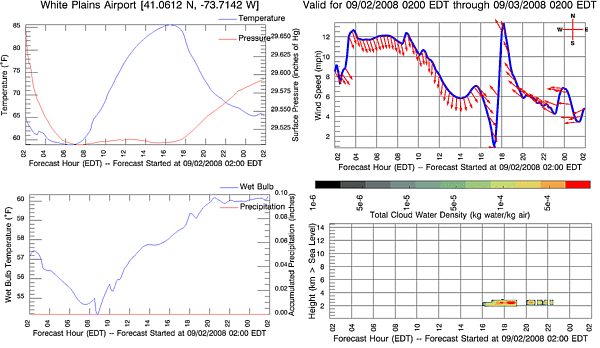
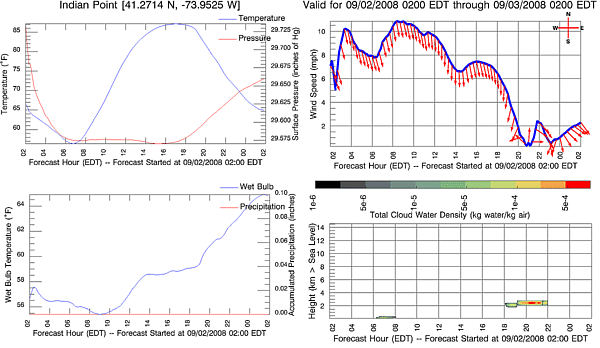
The plots on the left each show two variables
while the plots on the right each show one. The top left plot presents
temperature (blue) and pressure (red).
If the temperature range includes the freezing point of water, the plot will be marked
with a horizontal black line at 32 degrees Fahrenheit.
The bottom left panel shows wet bulb temperature
(blue)
and precipitation (red). Since the precipitation
is accumulated through the model run, the slope of the curve will be indicative
of the predicted rate of precipitation. Therefore, when the slope
is zero, it is not raining (or snowing). In addition, the model calculations
require some time to "spin-up" the microphysics to enable precipitation.
Therefore, there will typically be no precipitation in the first couple
of hours of model results.
The top right plot illustrates forecasted winds -- speed
(blue) and direction (red).
The wind direction is shown via the arrows that are attached to the wind
speed plot. The arrows indicate the predicted (compass) direction
to which the wind is going. The bottom right plot is a colored contour
map of forecasted total (water and ice) cloud water density as a function
of elevation and time. This "cross-sectional" slice can provide information
related to storms, fog, visibility, etc. predicted at this location.
Portions of the plot in white imply time or elevations where there are
little or no clouds. Areas in yellow, orange and red imply when and
where the relatively densest clouds are forecasted, following the color
legend on the top of the panel.
Click on any of the plots to display a full-size version.


You can learn more about this technology, relevant data
and weather forecasting, at the following sites:
More Visualizations of the
Current Forecast
Learn More about These Forecasts
Recent High-Resolution Local
Satellite Observations
Learn
More about Deep Thunder
Learn
More about how Deep Thunder Visualizes the Data Generated by the
Weather Model
Current Weather
Information and Predictions for New York City (from the National Weather
Service)
Current Model Results from the
National Weather Service
Recent High-Resolution Local Radar Observations
Evaluation of Recent Forecasts

lloydt@watson.ibm.com