Current Deep Thunder Forecast for the IBM Somers site

Products for IBM Facility Management

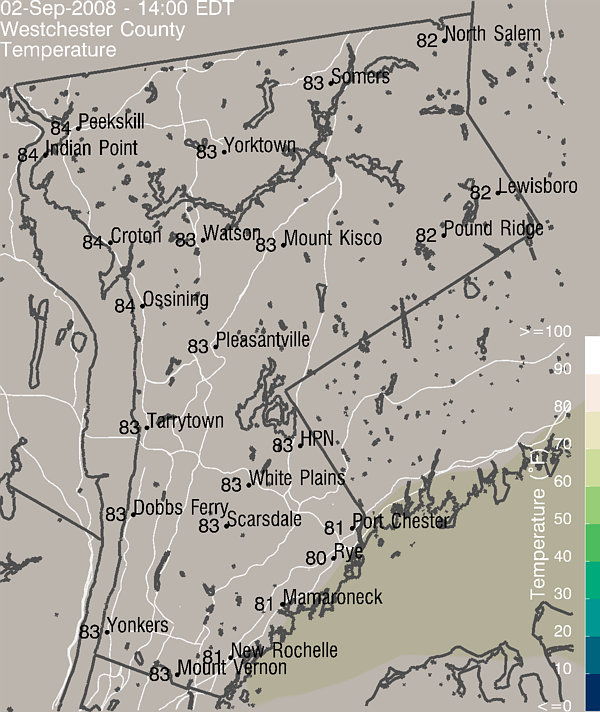
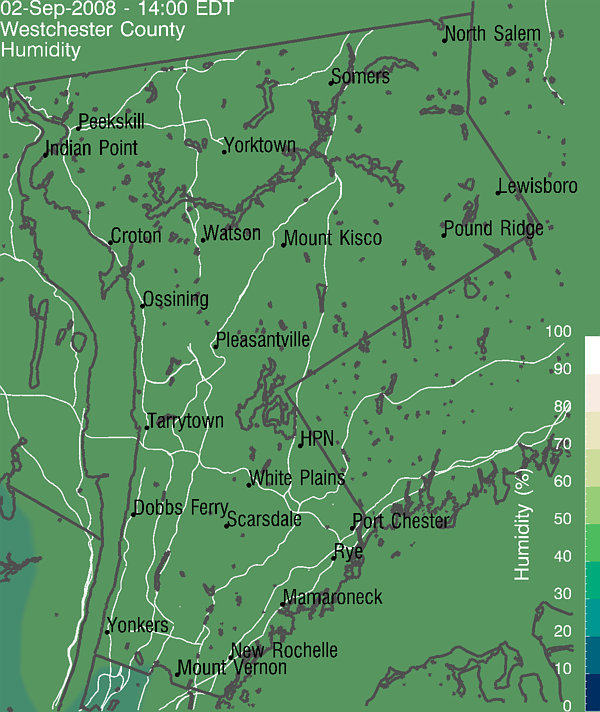
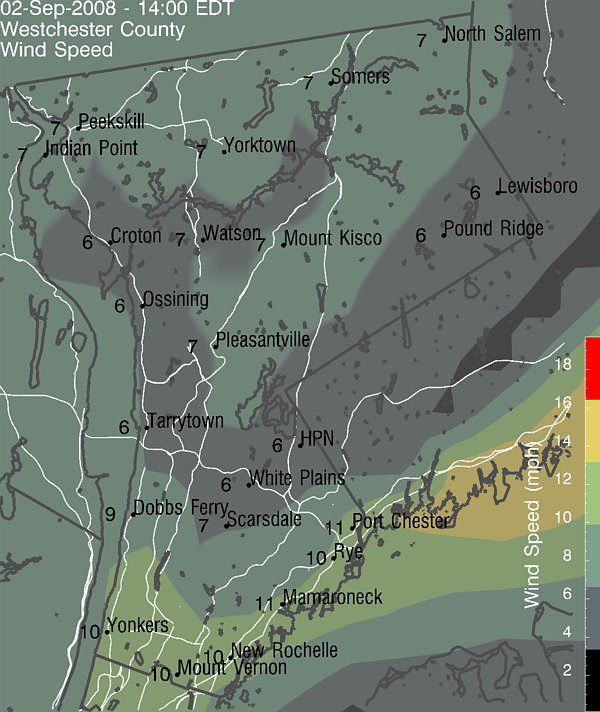
Click on any of the three images below to see and/or interact with
these model forecast products. All of them show forecasted information
in Westchester County. The first focuses on temperature,
the second focuses on precipitation and the third shows winds, while the fourth illustrates
clouds and surface conditions at the Somers site via a set of 8-panel plots.
There a number of forecasted weather variables shown in the eight
panels as determined from the model for the Somers site, as a function of time
for the forecast period. Six of the plots each show two variables
while the other two plots each show one. The top left plot presents
temperature (blue) and pressure (red).
If the temperature range includes the freezing point of water, the plot will be marked
with a horizontal black line at 32 degrees Fahrenheit.
The left panel in the second row shows humidity
(blue)
and precipitation (red). Since the precipitation
is accumulated through the model run, the slope of the curve will be indicative
of the predicted rate of precipitation. Therefore, when the slope
is zero, it is not raining (or snowing). In addition, the model calculations
require some time to "spin-up" the microphysics to enable precipitation.
Therefore, there will typically be no precipitation in the first couple
of hours of model results.
The top right plot illustrates forecasted winds -- speed
(blue) and direction (red).
The wind direction is shown via the arrows that are attached to the wind
speed plot. The arrows indicate the predicted (compass) direction
to which the wind is going. The right plot in the second row is a colored contour
map of forecasted total (water and ice) cloud water density as a function
of elevation and time. This "cross-sectional" slice can provide information
related to storms, fog, visibility, etc. predicted at this location.
Portions of the plot in white imply time or elevations where there are
little or no clouds. Areas in yellow, orange and red imply when and
where the relatively densest clouds are forecasted, following the color
legend on the top of the panel.
The third row shows other ways to examine moisture and temperature. On the left are
plots of wet bulb temperature (blue) and
dew point temperature (red). On the right are
two representations of apparent temperature, heat index (blue)
and wind chill (red). The former is used primarily in the summer and
represents the impact of humidity on apparent temperature. Wind chill represents the
influence of wind on the skin as an apparent temperature, commonly used during the winter.
The fourth row shows provides additional information about precipitation. On the left
are estimates of snow totals based upon two different algorithms of deriving snow from the
liquid precipitation that the model calculates. The "dry" algorithm (blue)
assumes the snow is
very light and fluffy, and utilizes information about just the amount of liquid and the
temperature. The "wet" algorithm (red) is much more conservative, assuming the snow is quite
compact and wet. In both cases, as with the liquid precipitation plot above, the amounts are
integrated through the model run. On the right are liquid (rain equivalent blue) and snow
accumulation (red) on an hourly basis. These plots essentially provide an estimate for the rate of
precipitation.
Click on the plot to display a full-size version.

You can learn more about this technology, relevant data
and weather forecasting, at the following sites:
More Visualizations of the
Current Forecast
Learn More about These Forecasts
Recent High-Resolution Local
Satellite Observations
Learn
More about Deep Thunder
Learn
More about how Deep Thunder Visualizes the Data Generated by the
Weather Model
Current Weather
Information and Predictions for New York City (from the National Weather
Service)
Current Model Results from the
National Weather Service
Recent High-Resolution Local Radar Observations
Evaluation of Recent Forecasts

lloydt@watson.ibm.com