Welcome to the
IBM Deep Thunder Visualized Numerical Weather Predictions for New York City.
The goal of this project is to enable reliable, affordable,
high-resolution numerical weather prediction for a variety of applications.
One part of this effort is to generate such forecasts on an operational
basis and evaluate the results. In particular, "nested" forecasts
at 16, 4 and 1 km resolution (areas of 976x976, 244x244 and 61x61 km in
size, respectively) are generated centered over New York City tied to multi-resolution
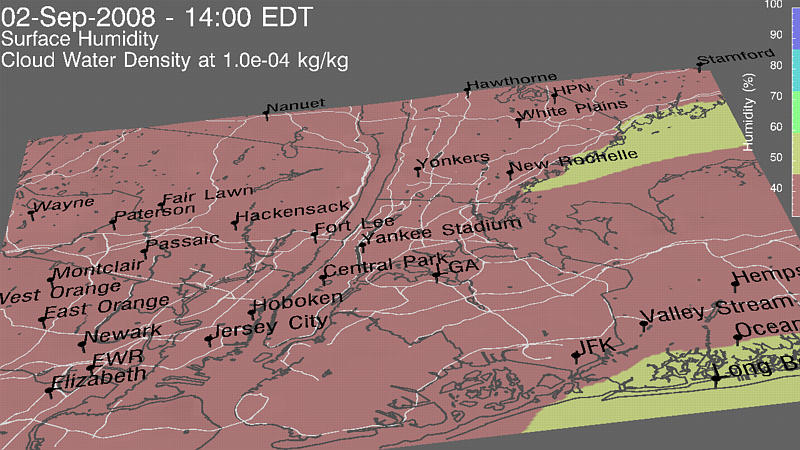
visualizations, which are presented here. The idea is to illustrate
how the forecasts can be tailored to the geographic region of interest
enabling one to "zoom in" on New York.
This web site provides visual representations of these
forecasts on an experimental near-real-time basis. These visualizations
are provided as-is with no guarantee as to their quality or reliability.
IBM bears no responsibility or liability concerning the accuracy or availability
of these visualizations as their production depends on many external factors.
Although they are provided without direct interpretation, the underlying
forecasts and the visualizations will continue to evolve in an effort to
refine the technology, usability and the science as well as to understand
their potential value for both businesses and consumers.
You can see results of the most recent Deep Thunder
forecast on the next
page as well as at the bottom of this page.
A Summary of the Current
Deep
Thunder Forecast Can Be Interactively Viewed with Images and Animations
by Clicking
Here
Additional Visualizations of
the Current
Deep Thunder Forecast Can Be Viewed by Clicking
Here
This project
is taking place at the IBM Thomas
J. Watson Research Center, located in Yorktown Heights, NY. That
location
is within the 4 km nest for these forecasts. The results of the current
forecast at that location (latitude 41o
12' 32" North, Longitude 73o
48' 13" West from a GPS receiver outside of our building near our offices
and weather lab) are shown in the plots below.
There are a number of weather variables shown in the four
panels as determined from the model at this location as a function of time
for the forecast period. The plots on the left each show two variables
while the plots on the right each show one. The top left plot presents
temperature (blue) and pressure (red).
The bottom left panel shows humidity (blue)
and precipitation (red). Since the precipitation
is accumulated through the model run, the slope of the curve will be indicative
of the predicted rate of precipitation. Therefore, when the slope
is zero, it is not raining (or snowing). In addition, the model calculations
require some time to "spin-up" the microphysics to enable precipitation.
Therefore, there will typically be no precipitation in the first couple
of hours of model results.
The top right plot illustrates forecasted winds -- speed
(blue) and direction (red).
The wind direction is shown via the arrows that are attached to the wind
speed plot. The arrows indicate the predicted (compass) direction
to which the wind is going. The bottom right plot is a colored contour
map of forecasted total (water and ice) cloud water density as a function
of elevation and time. This "cross-sectional" slice can provide information
related to storms, fog, visibility, etc. predicted at this location.
Portions of the plot in white imply time or elevations where there are
little or no clouds. Areas in yellow, orange and red imply when and
where the relatively densest clouds are forecasted, following the color
legend on the top of the panel.
Similar plots to these are also
available for twenty-fve other locations, thirteen of which are within the 1 km
nest:
IBM Research
in Hawthorne, NY, White Plains Airport
(HPN), southern Manhattan, Central
Park, LaGuardia Airport, Kennedy
Airport, Newark Airport, Yankee
Stadium, Shea Stadium, Yonkers, NY,
IBM
Palisades, IBM White Plains and
Brooklyn, NY. Ten of the other eleven are in New York State within the 4
km nest: Cortlandt Manor, Buchanan,
Poughquag, IBM East
Fishkill,
IBM Poughkeepsie,
IBM Somers, IBM Armonk,
IBM Sterling Forest, Garrison
and Hillburn.
The last two plots are within the 16 km nest for Albany, NY and
IBM Burlington.
Additional such plots for other locations will be added soon.
Also, if you are
interested in subscribing to the experimental Deep Thunder e-mail weather warning
system, please send us e-mail.
You can learn more about this technology, relevant data
and weather forecasting, at the following sites:
Learn
More about These Forecasts
Recent
High-Resolution Local Satellite Observations
Learn
More about Deep Thunder
Learn
More about how Deep Thunder Visualizes the Data Generated by the
Weather Model
Current Weather
Information and Predictions for New York City (from the National Weather
Service)
Current
Model Results from the National Weather Service
Recent
High-Resolution Local Radar Observations
Evaluation of Recent Forecasts

lloydt@watson.ibm.com