Welcome to the IBM Deep Thunder Operational Weather Forecasting Sites
The goal of this project is to enable reliable, affordable,
high-resolution numerical weather prediction for a variety of applications.
One part of this effort is to generate such forecasts on both an operational and
experimental basis and evaluate the results. In particular, forecasts are regularly produced
for several metropolitan areas in the United States (e.g., New York, Chicago, Kansas City,
Philadelphia, Atlanta, Orlando,
Miami, San Diego, San Francisco, Albany, Austin, San Antonio, Baltimore and Washington).
The results are available via a number of
web pages, focused on different aspects of how they may be used.
You can see these forecast products by visiting the sites as outlined below.
Main page for New York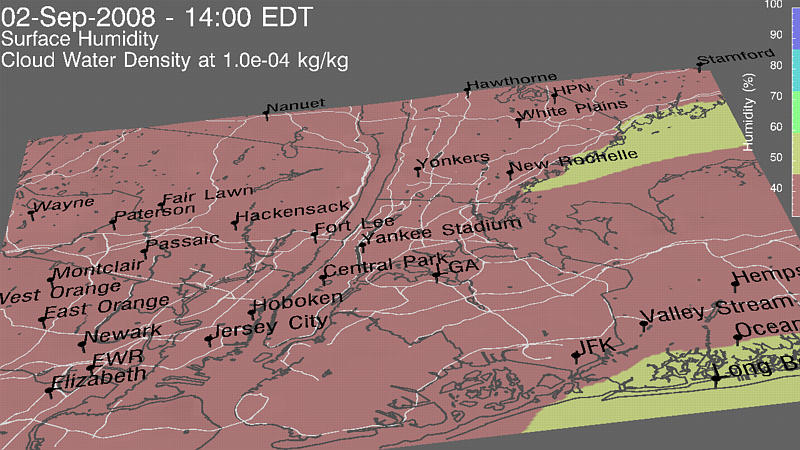
Generic images and animations
Prototype applications for ConEd
Operational applications for ConEd Bronx-Westchester
Products oriented toward airport terminal operations
Westchester County, NY
IBM Yorktown site operations
IBM Somers site operations
Prototype road weather applications for New York State
Products oriented toward meteorological analysis
Surface and upper air wind forecast products oriented toward homeland security applications
New York, NY and Newark, NJ
New York Stock Exchange
Downtown Newark, NJ
Westchester County, NY
Indian Point Energy Center, Buchanan, NY
Main page for Philadelphia, PA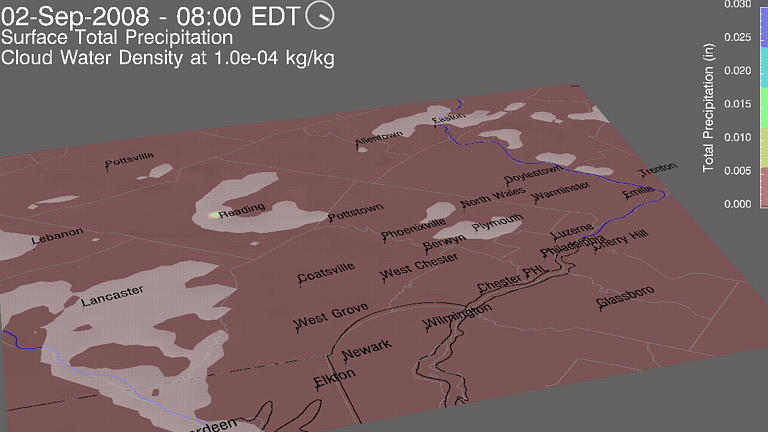
Intermediate resolution forecast page covering
most of Pennsylvania, Maryland, Virginia,
Connecticut, Massachusetts and New York, and all of Delaware and New Jersey
Prototype applications for Exelon/PECO
Main page for expanded Chicago, IL area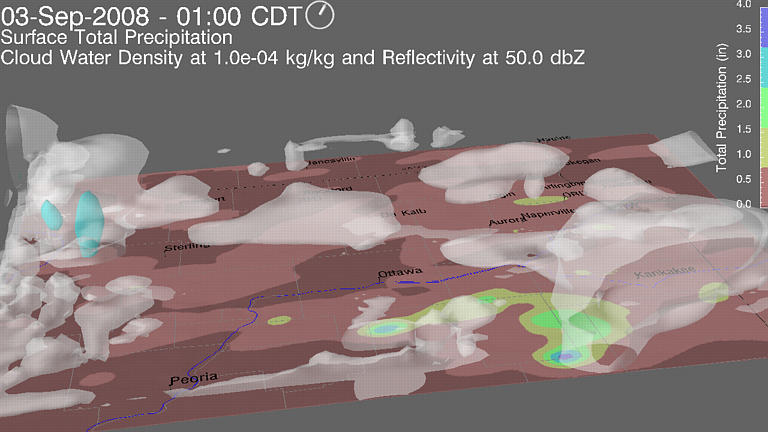
Intermediate resolution forecast page covering
all of Illinois and parts of Iowa, Missouri, Indiana and Michigan
Prototype applications for Exelon/ComEd
Prototype applications for the
Metropolitan Water Reclamation District for Greater Chicago
Main page for Chicago, IL
Main page for Kansas City, MO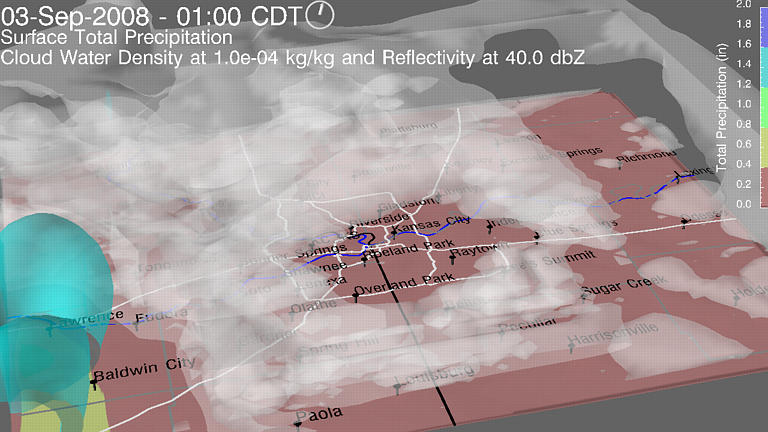
Intermediate resolution forecast page covering
eastern Kansas, western Missouri, and parts of Nebraska, Iowa and Oklahoma
Main page for Washington, DC and Baltimore, MD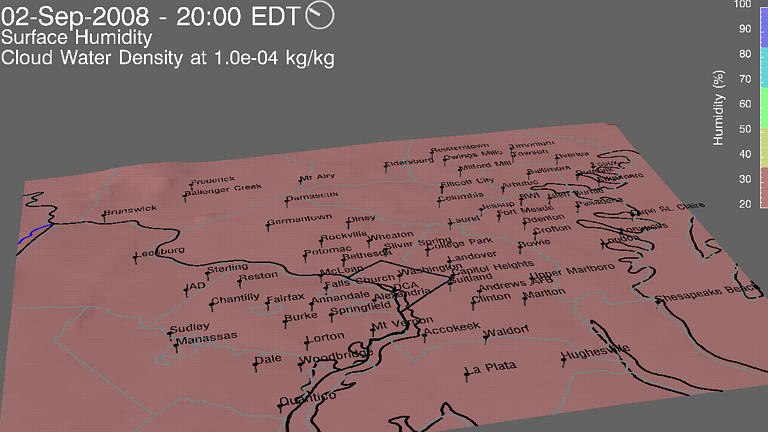
Intermediate resolution forecast page covering all of Maryland and Delaware, most of Pennsylvania, Virginia, and New Jersey, and part of West Virginia
Intermediate and high-resolution forecast products
oriented toward meteorological analysis
Main page for Atlanta, GA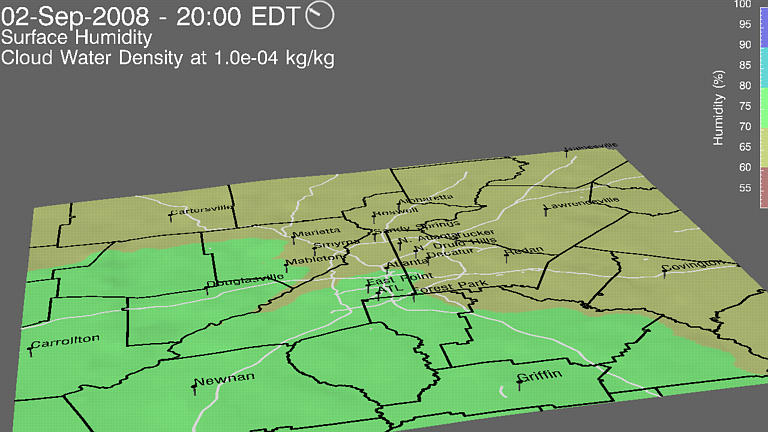
Intermediate resolution forecast page covering
Georgia, Alabama, South Carolina and North Carolina
Main page for Miami/Fort Lauderdale, FL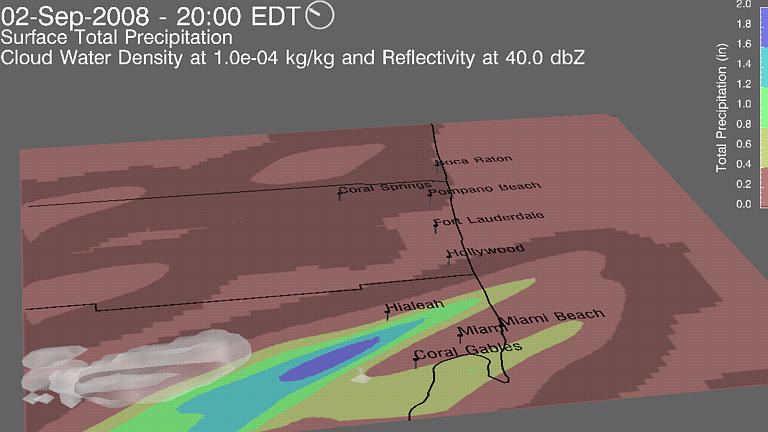
Intermediate resolution forecast page covering southern Florida
Main page for Orlando, FL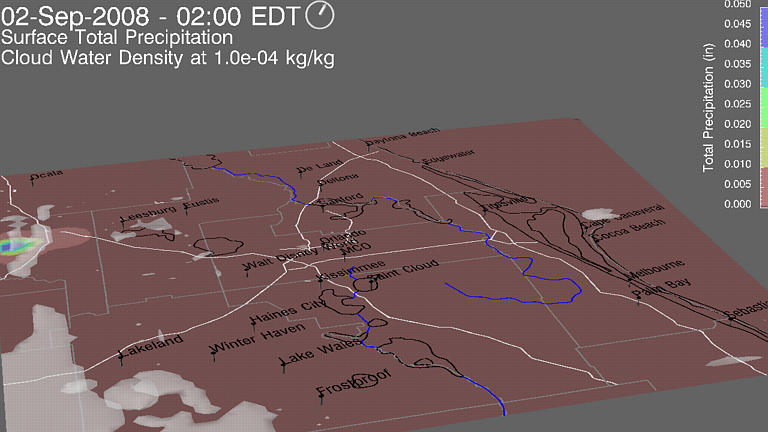
Main page for western Massachusetts, eastern New York,
southwestern Vermont and southwestern New Hampshire
Main page for Austin and San Antonio, TX
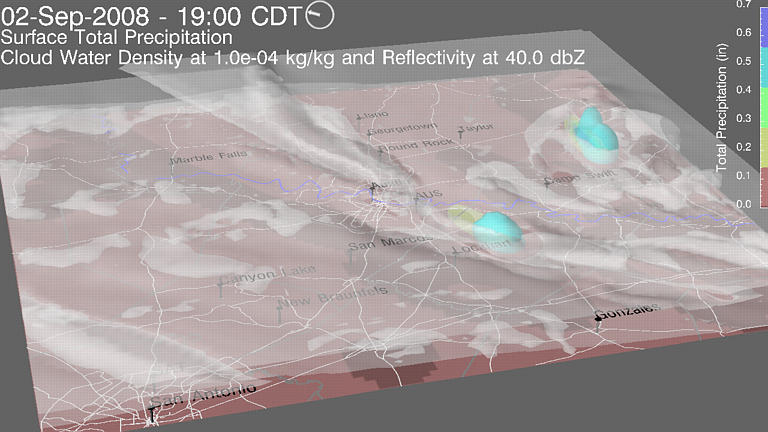
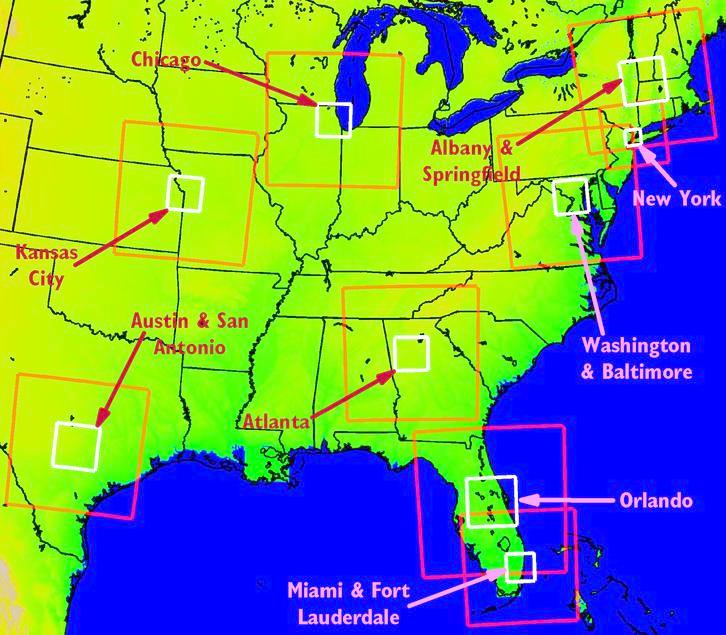
The image below places many of these forecasts in a geographic context, which shows a
map of the eastern two-thirds of the continental United States. On the map
are two regions associated with many of the aforementioned metropolitan
areas. They correspond to the two, innermost of the triply nested, multiple resolution forecasting
domains used to produce each high-resolution weather forecast.
The intermediate nests are in red and the inner nests are in white.
The areas within the red borders are covered at 8 km resolution for Kansas City,
Chicago, Atlanta and Baltimore/Washington;
7 km for Orlando;
6 km for eastern New York and western Massachusetts, and Austin/San Antonio and Miami-Fort Lauderdale;
and 4 km resolution for New York.
The areas within the white borders are covered at 2.33 km for Orlando;
2 km resolution for Kansas City, Chicago, Atlanta, Baltimore/Washington, eastern New York and western Massachusetts, and
Austin/San Antonio; 1.5 km for Miami-Fort Lauderdale and 1 km resolution for New York.
Main page for San Diego, CA (occasional, experimental forecasts at 1 km resolution)
Main page for San Francisco, CA (occasional, experimental forecasts at 1.25 km resolution)
You can learn more about this technology, relevant data
and weather forecasting, at the following sites:
Learn
More about These Forecasts
Learn
More about Deep Thunder
Learn
More about how Deep Thunder Visualizes the Data Generated by the
Weather Model
This web site provides visual representations of these
forecasts on an experimental near-real-time basis. These visualizations
are provided as-is with no guarantee as to their quality or reliability.
IBM bears no responsibility or liability concerning the accuracy or availability
of these visualizations as their production depends on many external factors.
Although they are provided without direct interpretation, the underlying
forecasts and the visualizations will continue to evolve in an effort to
refine the technology, usability and the science as well as to understand
their potential value for both businesses and consumers.
lloydt@us.ibm.com